A Closer Look at Asynchronous Compute in 3DMark Time Spy
July 19, 2016
Every Futuremark benchmark is accompanied by a detailed technical guide that explains how the test works, what it measures, and how the scores are calculated. We create these guides to provide transparency to hardware press who use our benchmarks for reviews, to our industry customers, and for technically-minded gamers and overclockers.
The aim of the technical guide is to bridge the gap between code-level implementation that requires expert knowledge and a typical enthusiast's understanding of modern APIs and real-time graphics. But, occasionally, there is enough interest and excitement around a new feature or technique that a more detailed look is called for. One such technique in DirectX 12 is asynchronous compute.
In this post, we'll explain how command lists, command queues, and specifically, asynchronous compute are used in 3DMark Time Spy.
Before we dive into the technical details, it is worth explaining how we make benchmarks at Futuremark and the steps we take to ensure that our tests are accurate, relevant, and impartial.
Benchmark development process
As with every 3DMark release, Time Spy was developed with input from industry leaders including AMD, Intel, Microsoft, NVIDIA, and the other members of our Benchmark Development Program (BDP).
3DMark Time Spy has been in development for nearly two years, and BDP members have been involved from the start. BDP members receive regular builds throughout development and conduct their own review and testing at each stage. They have access to the source code and can suggest improvements and changes to ensure that the implementation is correct. All development takes place in a single source tree, which means anything suggested by a vendor can be immediately reviewed and commented on by the other vendors. Ultimately, each member approves the final benchmark for release to the press and public.
Of all the 3DMark tests we have created over the years, Time Spy has probably seen the most scrutiny from our partners. Each vendor had staff spend weeks in our office working with our engineers. The daily source code drops we offer have been downloaded hundreds of times. We have around one thousand emails of vendor communication related to Time Spy. Every detail has been debated and discussed at length.
When there are conflicting views we listen to all parties to hear their opinions and look at the supporting data they provide. We also talk to game developers to hear their views and experiences. When deciding on the implementation, our main guideline is to ask, "Is this the approach a game developer would take?" when considering whether the gain in performance is sufficient for the amount of developer time required.
Benchmark design and principles
In all Futuremark benchmarks we aim for neutrality by ensuring that all hardware is treated equally. Every device runs the same workload using the same code path. This is the only way to produce results that are fair and comparable.
In the past, we have discussed the option of vendor-specific code paths with our development partners, but they are invariably against it. In many cases, an aggressive optimization path would also require altering the work being done, which means the test would no longer provide a common reference point. And with separate paths for each architecture, not only would the outputs not be comparable, but the paths would be obsolete with every new architecture launch.
3DMark benchmarks use a path that is heavily optimized for all hardware. This path is developed by working with all vendors to ensure that our engine runs as efficiently as possible on all available hardware. Without vendor support and participation this would not be possible, but we are lucky in having active and dedicated development partners.
Ultimately, 3DMark aims to predict the performance of games in general. To accomplish this, it needs to be able to predict games that are heavily optimized for one vendor, both vendors, and games that are fairly agnostic. 3DMark is not intended to be a measure of the absolute theoretical maximum performance of hardware.
Overview of Command List usage in DirectX 12
Quoting from MSDN:
"Most modern GPUs contain multiple independent engines that provide specialized functionality. Many have one or more dedicated copy engines, and a compute engine, usually distinct from the 3D engine. Each of these engines can execute commands in parallel with each other. Direct3D 12 provides granular access to the 3D, compute and copy engines, using queues and command lists.
"The following diagram shows a title's CPU threads, each populating one or more of the copy, compute and 3D queues. The 3D queue can drive all three GPU engines, the compute queue can drive the compute and copy engines, and the copy queue simply the copy engine.
"As the different threads populate the queues, there can be no simple guarantee of the order of execution, hence the need for synchronization mechanisms - when the title requires them."

Command lists and execution
Unlike the Draw/Dispatch calls in DirectX 11 (with immediate context), in DirectX 12, the recording and execution of command lists are decoupled operations. This means that recording can and does happen as soon as it has all available information and there is no thread limitation on it.
For GPU work to happen, command lists are executed on queues, which come in variants of DIRECT (commonly known as graphics), COMPUTE and COPY. Submission of a command list to a queue can happen on any thread. The D3D runtime serializes and orders the lists within a queue.
Once initiated, multiple queues can execute in parallel. But it is entirely up to the driver and the hardware to decide how to execute the command lists - the game or application cannot affect this decision with the DirectX 12 API.
This parallelism is commonly known as ‘asynchronous compute’ when work is done on the COMPUTE queue at the same time as work is being done on the DIRECT queue.
DIRECT command list
This command list type supports all types of commands in DirectX 12. This includes Draw calls, compute Dispatches and Copies.
COMPUTE command list
This command list type supports compute Dispatch and Copy commands.
DIRECT queue
This queue can be used for executing all types of command lists supported by DirectX 12.
COMPUTE queue
This queue accepts compute and copy command lists.
COPY command list and queues
This command list and queue type accepts only copy commands and lists respectively.
Please see MSDN for an introduction to the Design Philosophy of Command Queues and Command Lists, and for more information on Executing and Synchronizing Command Lists.
Command List usage in 3DMark Time Spy
The Time Spy engine uses two command queues: a DIRECT queue for graphics and compute and a COMPUTE queue for asynchronous compute. This queue structure is used in every instance regardless of the capabilities of the hardware being tested.
The number of command lists is large as many tasks have their own command lists, (several copies so that frames can be pre-recorded).
The COPY queue is generally used for streaming assets, which is not needed in Time Spy as we load all assets before the benchmark run begins to ensure the test does not gain a dependency on storage or main memory.
Work items in the COMPUTE queue (in order of submission)
- Particle simulation
- Light culling and tiling
- Environment reflections
- Horizon based ambient occlusion
- Unshadowed surface illumination
Particle simulation
This pass is recorded and executed at the beginning of a frame because it doesn’t depend on the G-buffer. Thus its recording and submission is done in parallel with recording and submission of geometry draws (G-Buffer construction).
Light culling and tiling, Environment reflections, HBAO and Unshadowed surface illumination
These passes are recorded and submitted in parallel with G-Buffer recording and submission, but executed only after the G-Buffer has finished executing and in parallel with shadow map draws execution. This is because they depend on the G-Buffer, but not on the shadow maps.
Simplified DAG of 3DMark Time Spy queue usage

- Grey tasks are CPU tasks.
- Green tasks are submissions to the DIRECT queue.
- Red tasks are submissions to the COMPUTE queue
- Yellow tasks are submissions of synchronization points to the queue they’re pointing to. If there are no dependencies between the tasks then they are executed on the CPU in parallel.
- Each task encapsulates a complex task substructure which is omitted in this simplified graph for clarity.
- The async_illumination_commands tasks contain: light culling and tiling, environment reflections, HBAO and unshadowed surface illumination.
The significance of synchronization point tasks can be seen by noting that “execute_async_illumination_commands” cannot be executed on the GPU before “execute_gbuffer_commands” is completed, but the submission happens ahead of the execution unless we are CPU bound. So the GPU needs to know that it should wait for one task to complete execution before a dependent task can begin executing, when the execution is split between queues then this operation should be done by the engine otherwise, a RAW hazard occurs.
The dependency between particle simulation and completion of particle illumination in the previous frame is necessary because simulation happens on the COMPUTE queue which is not synchronized by the Present occurring on the DIRECT queue so a WAR hazard occurs.
Task summary
DIRECT queue - G-buffer draws, shadow map draws, shadowed illumination resolve, and post-processing are executed on the direct queue. G-buffer draws, shadow maps and some parts of post-processing are done with graphics shaders, while illumination resolve and the rest of the post-processing is done in compute shaders.
COMPUTE queue - Particle simulation, light culling and tiling, environment reflections, HBAO and unshadowed surface illumination resolve are executed on the compute queue. All tasks in compute queue must be done in compute shaders.
The order of submission can be obtained from the dependency graph. However, it is entirely up to the driver and the hardware to decide when to actually execute the given list as long as it is executed in order in its queue.
How tasks are submitted to the hardware
Next we will use a Microsoft tool called GPUView to see how Time Spy tasks are queued and executed at the hardware level for a variety of graphics cards models.
In the images captured from GPUView, the queues that exist on the device context side are at the bottom, while the queues in the top section are the hardware queues, which here are referred to as 3D, Compute and Copy.
The various colors signify different types of packets and from what process they’re coming from:
- Cyan-tinted packets are standard work item packets (darker ones are originating on DIRECT queue, while lighter on the COMPUTE queue)
- Pink packets are waits
- Reddish are signals (which release the waits)
- One type of dashed are presents the other is converted waits.
- The packets propagate from top to bottom on the device context queues and on the hardware queues.
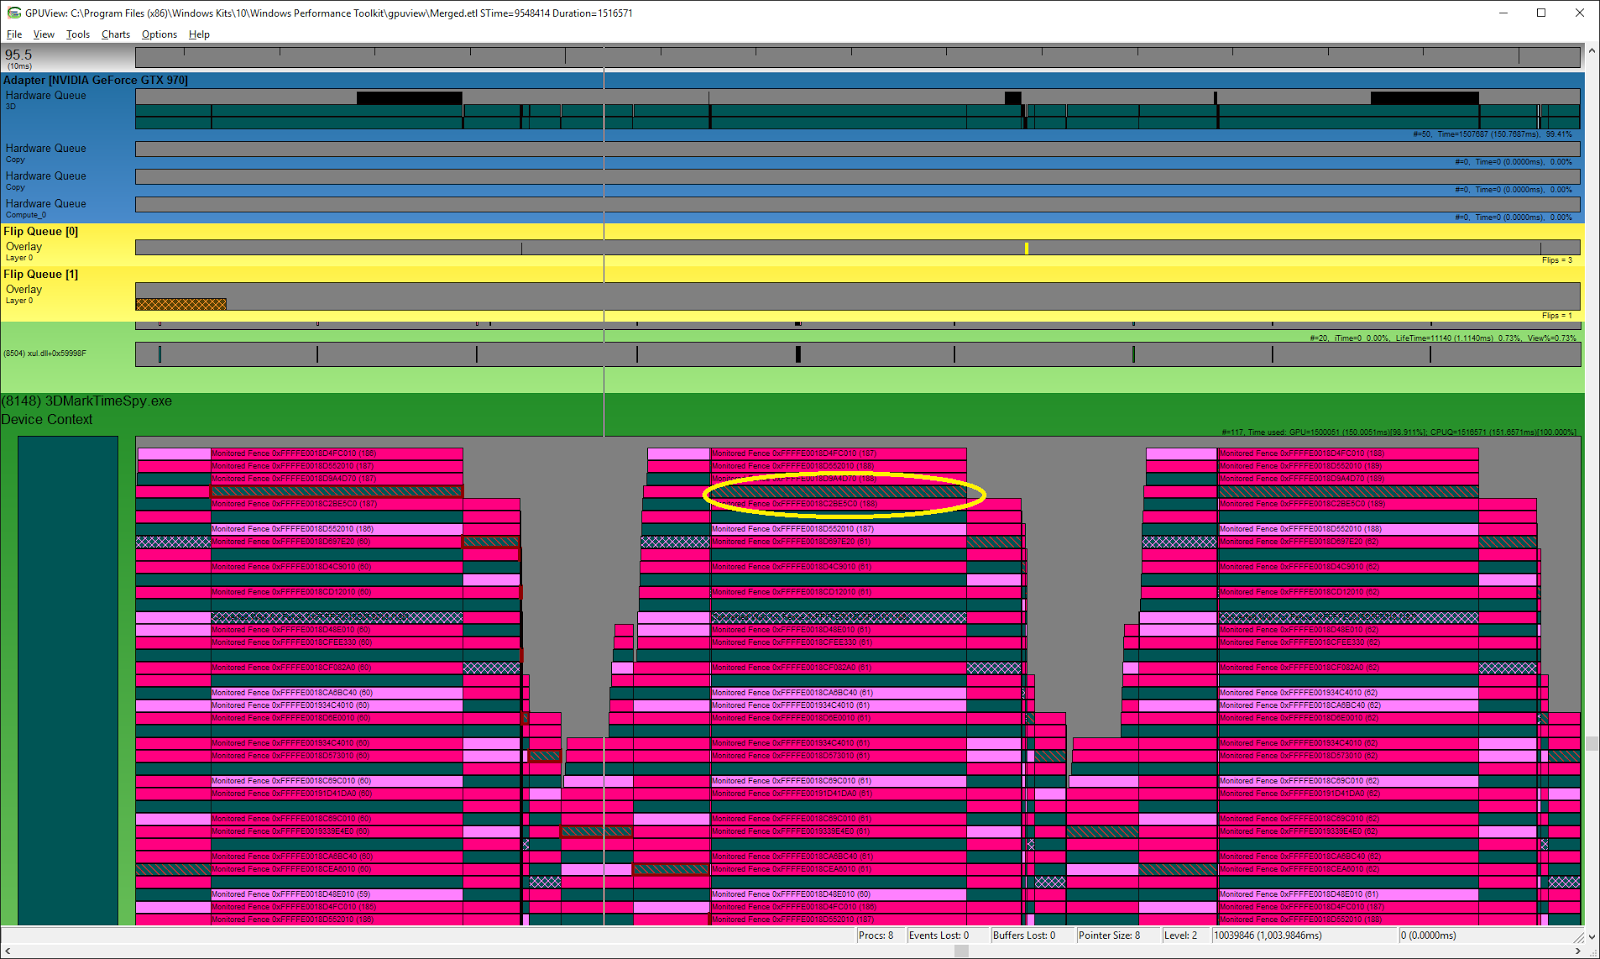
NVIDIA GeForce GTX 970
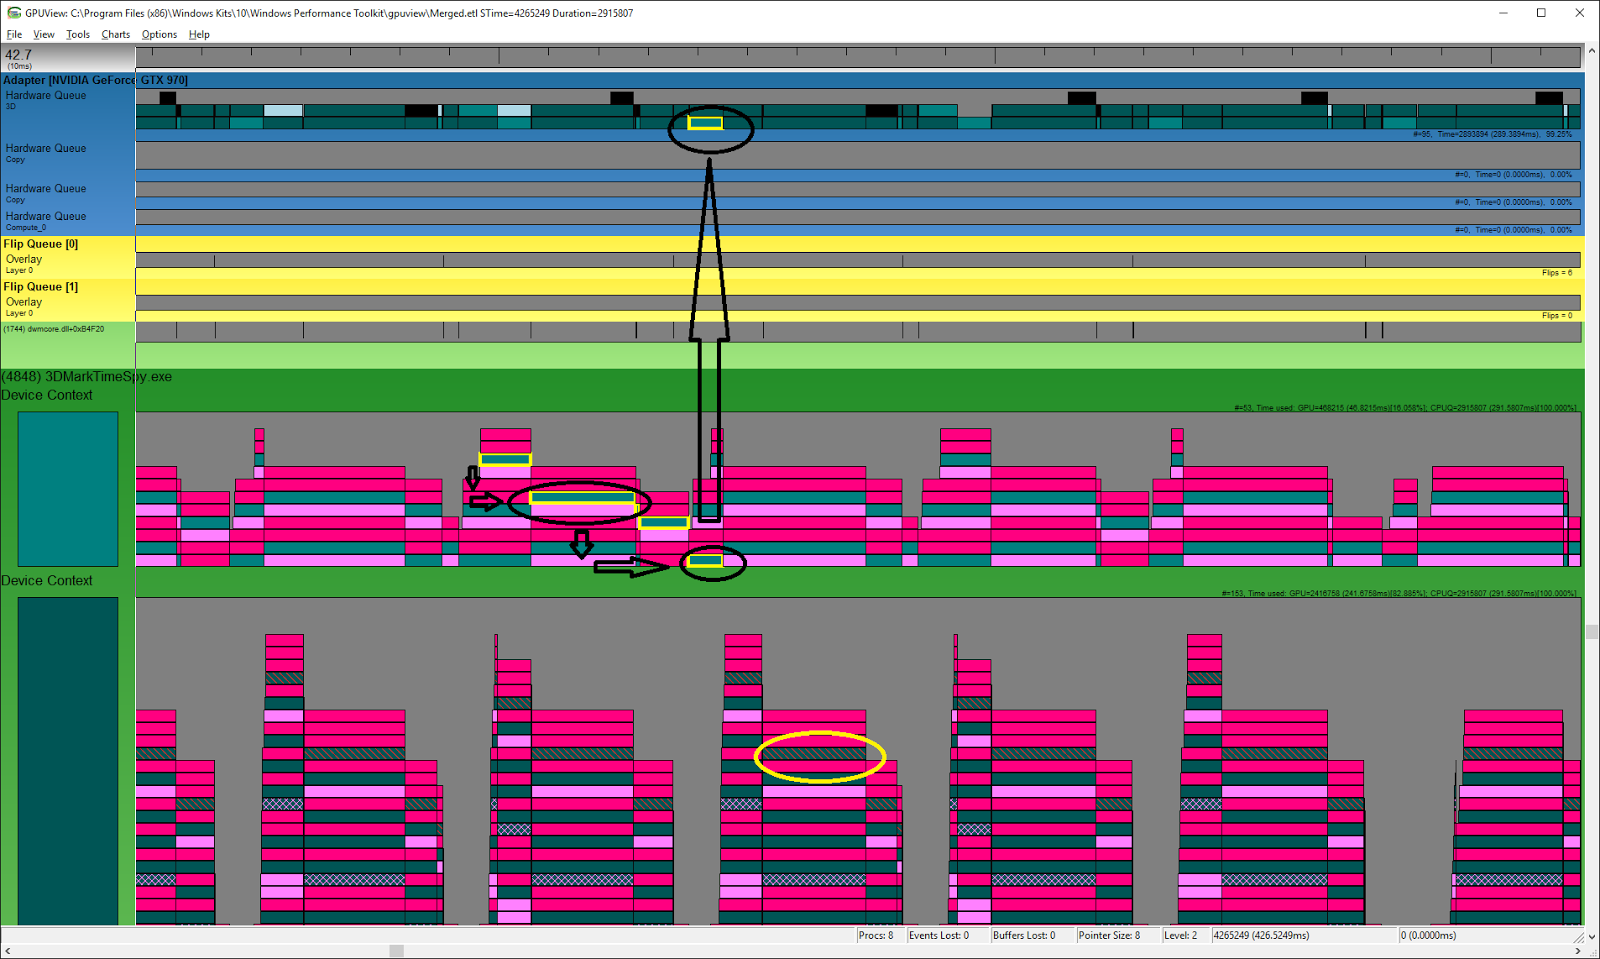
This is a screenshot of a trace taken on an NVIDIA GTX 970 viewed with GPUView. It shows when various packets are entering queues and when they leave them.
In this context, queues are used to hold all types of work items after being serialized by the D3D runtime as described here. It is possible to discern the type of the associated queue in the engine by the work items found in it.
The DIRECT queue can be identified by the present packets which are enclosed in this screenshot by a yellow ellipse. On the other hand the COMPUTE queue doesn’t contain any present packets, and overall contains significantly less items than the DIRECT queue because it’s packed better due to lower number of required synchronizations.
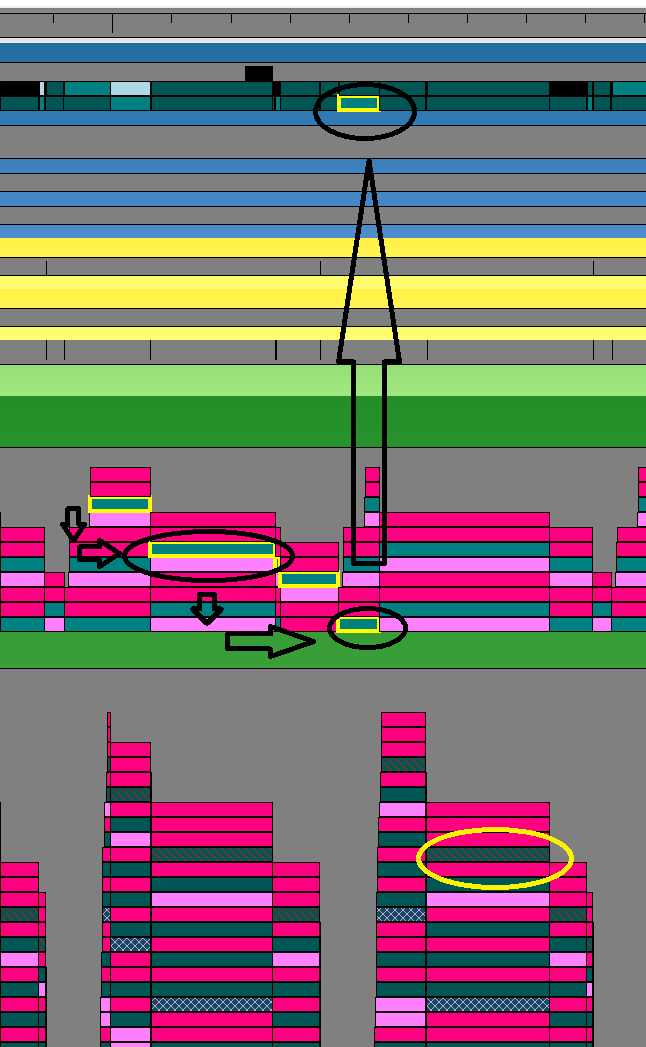
This is a zoomed-in image in which the propagation can be observed more closely. The black ellipses signify compute load originating on a dedicated compute queue and being serialized by the driver to the hardware 3D queue. The yellow ellipse is to distinguish the device context DIRECT queue by the present packets.
From this image, we can see that although work is submitted in two separate queues, the queues are merged to execute on a single hardware queue.
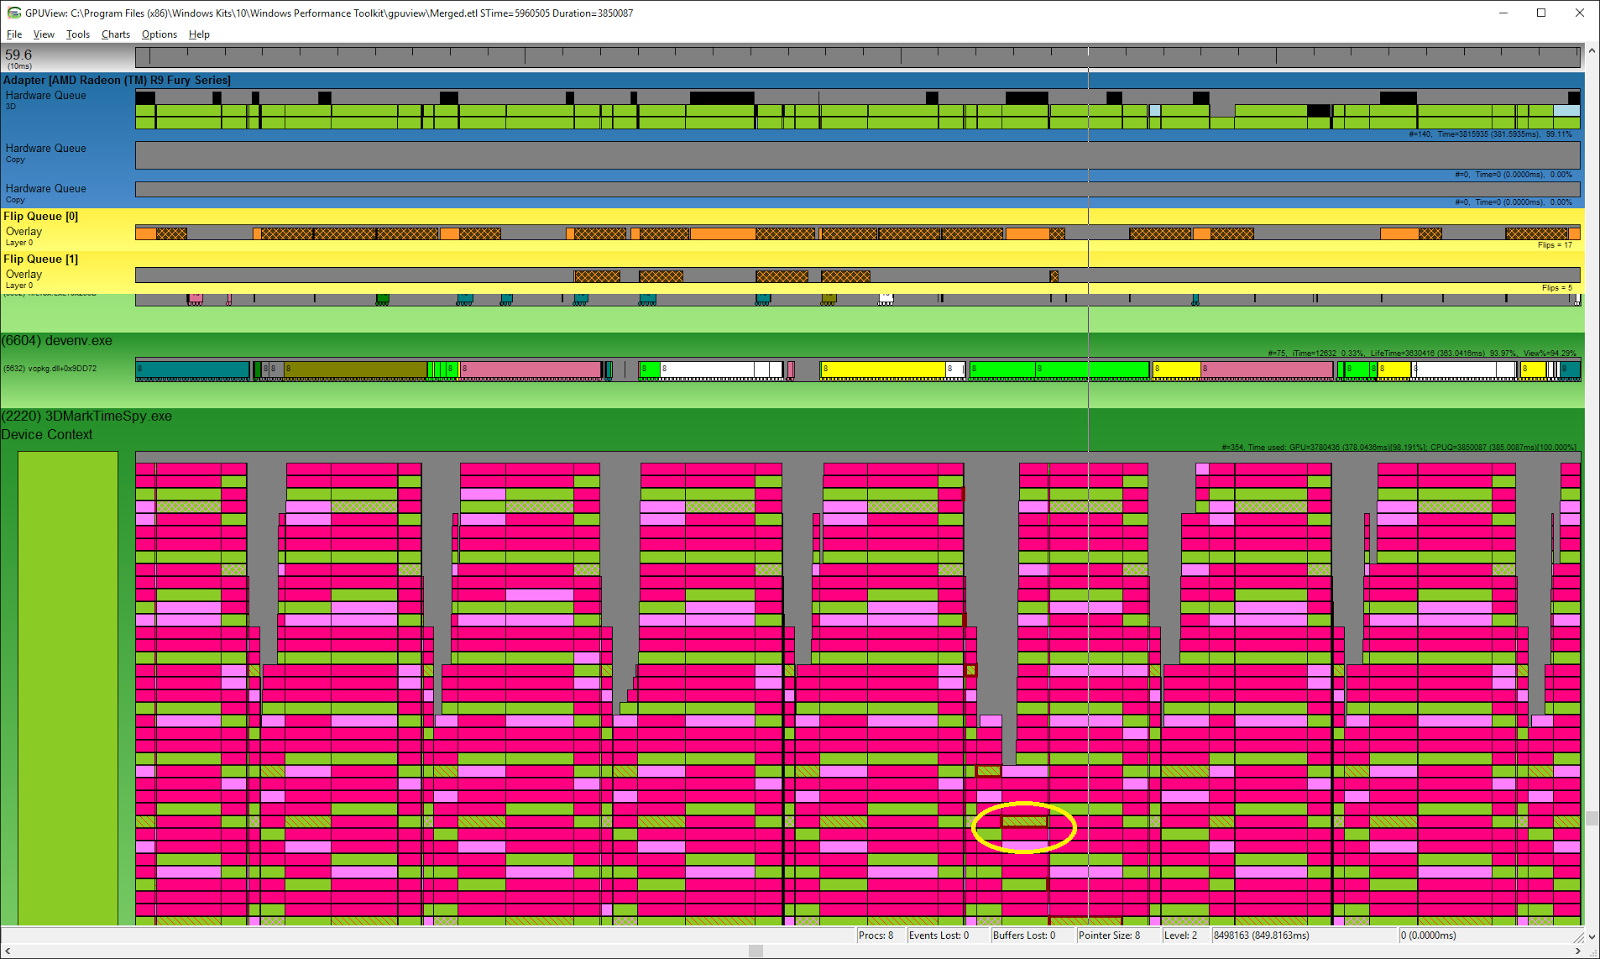
AMD Radeon Fury
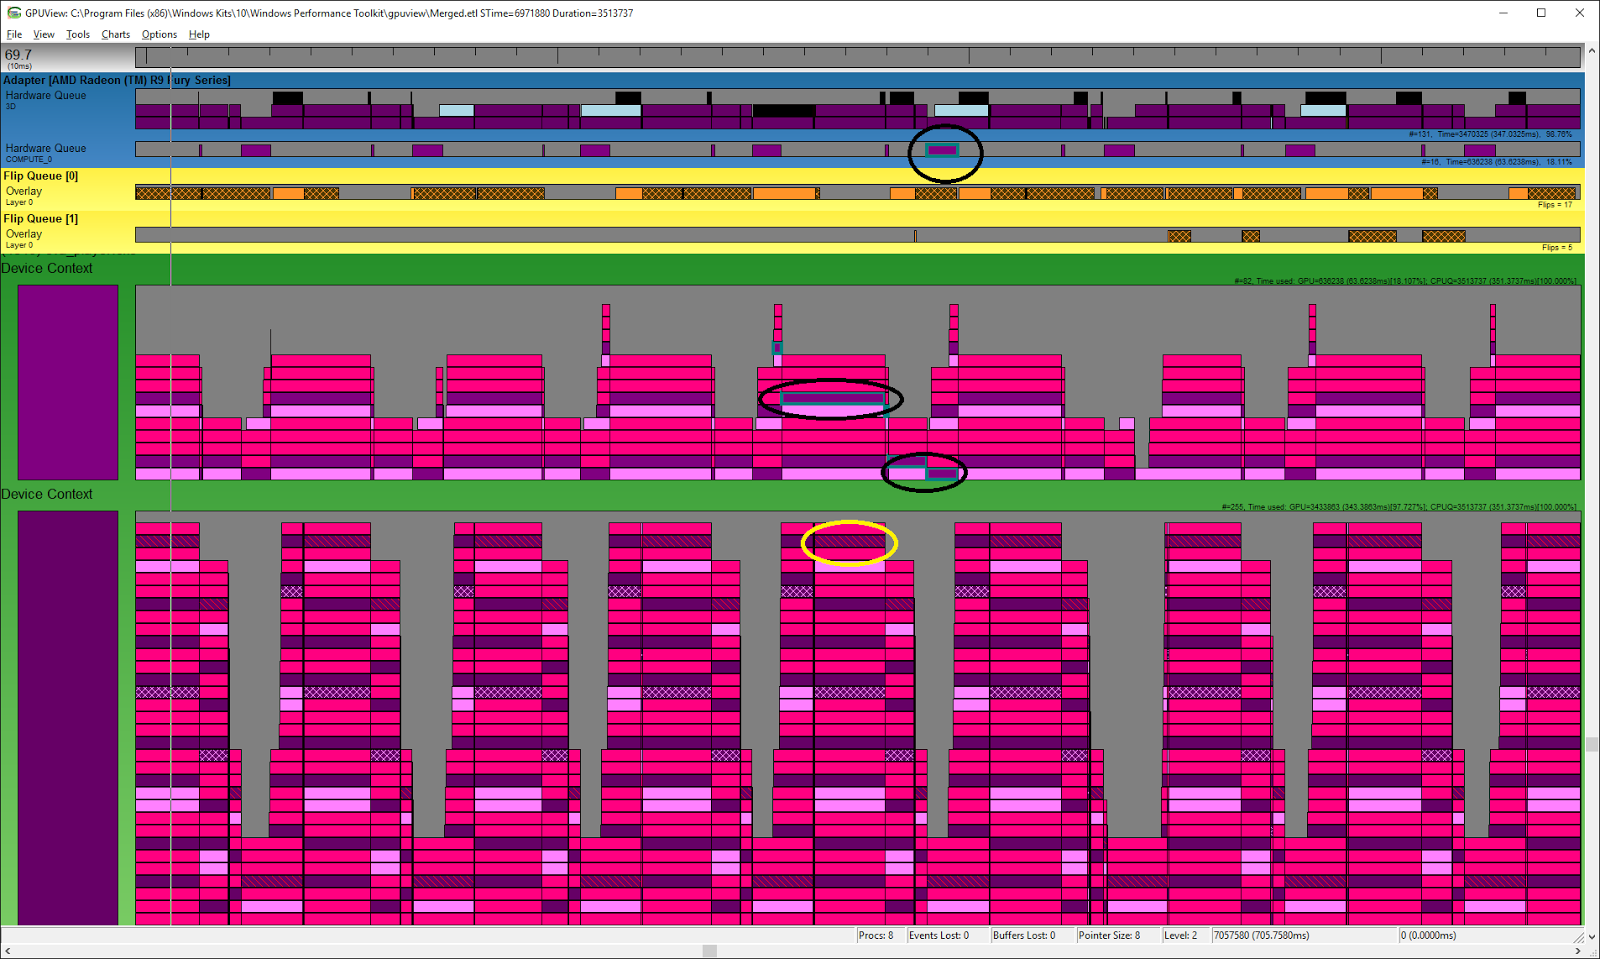
Here is a corresponding trace from an AMD Radeon Fury. Two dedicated queues can clearly be observed on both the hardware and the device context side. The black ellipses are pointing to a specific compute packet, while the yellow ellipse points to a present packet which helps to identify the DIRECT queue.
NVIDIA GeForce GTX 1080
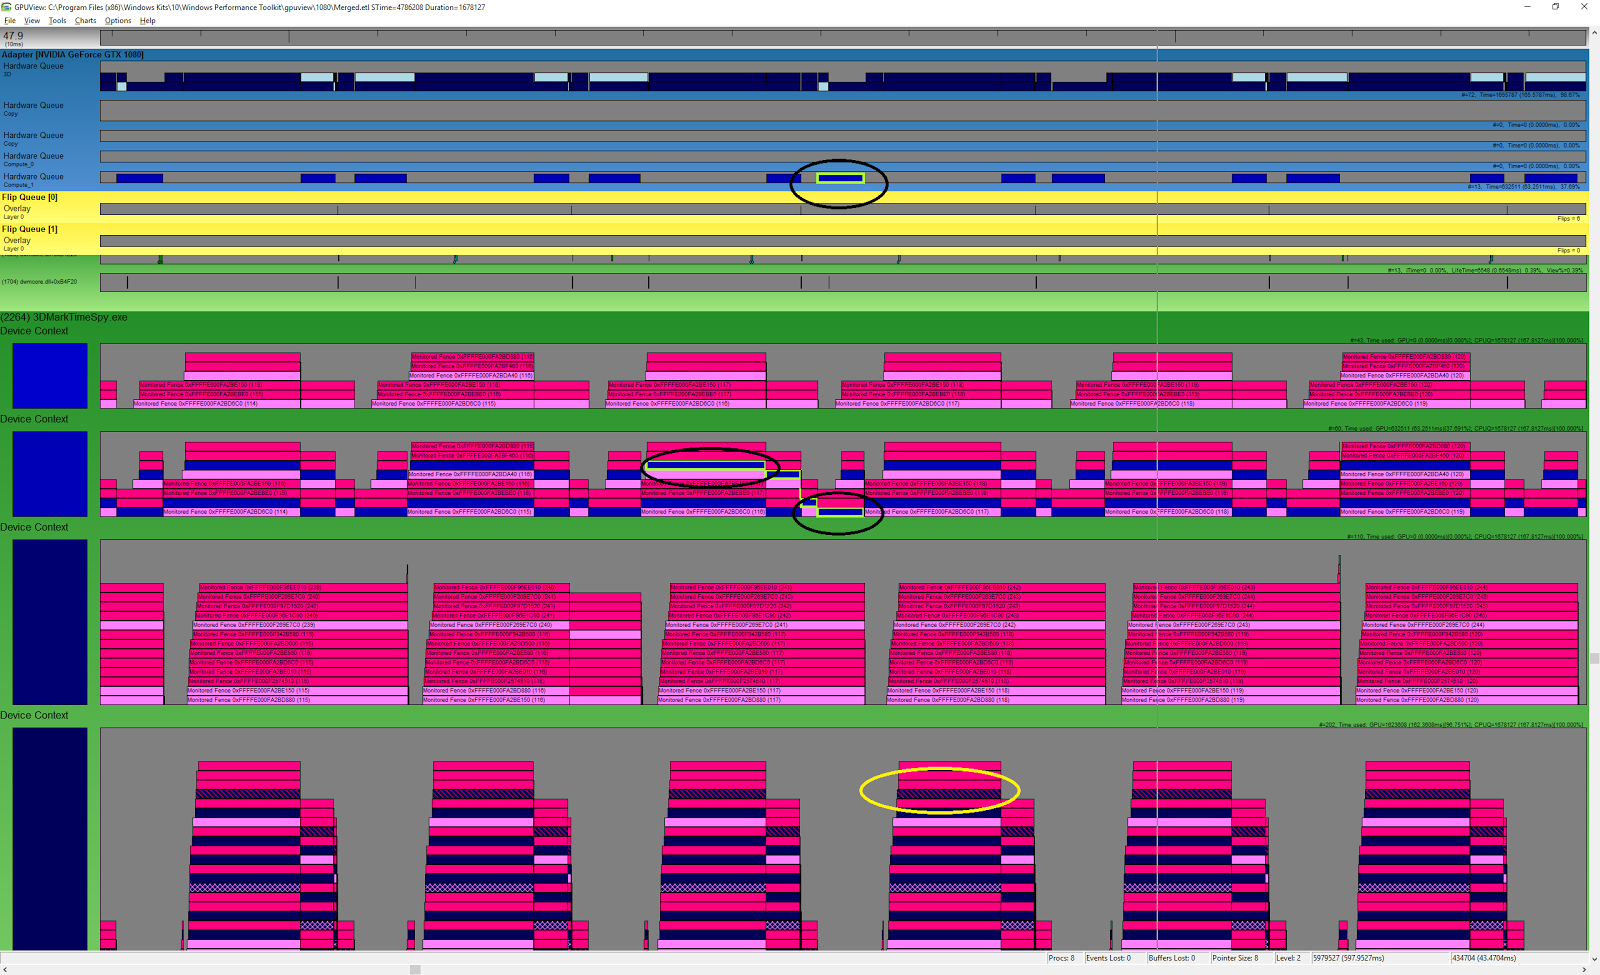
Above is a corresponding trace from an NVIDIA GTX 1080. As can be seen the general structures resemble those which are found on AMD Radeon Fury, albeit with extra queues that do not originate from the engine and which contain only synchronization items. From this image we can see that the GTX 1080 has an additional compute queue which accepts packets in parallel with the 3D queue.
Running with asynchronous compute disabled in benchmark settings
You can disable the use of asynchronous compute in the Time Spy benchmark workload by using the toggle found on the Time Spy custom run settings page (in 3DMark Advanced and Professional Editions). Running with asynchronous compute disabled in the benchmark forces all work to be done in the DIRECT queue.
Running without asynchronous compute does not have any effect on image quality. When asynchronous compute is disabled in the benchmark, all work items associated with the COMPUTE queue are simply moved to the DIRECT queue.
In the case where the driver decides to serialize dedicated compute work into the 3D queue, (the game or application cannot affect this decision), it’s up to the driver to place it in the correct order for execution so that visual quality will not be affected.
AMD Radeon Fury
The image above is a trace from an AMD Radeon Fury with asynchronous compute disabled in the benchmark. All work items exist only on one queue and get submitted to one hardware queue.
From this image we see that work submitted in a single queue will not be automatically distributed on the hardware even when it has an additional compute queue available. Work is only distributed on the hardware when the work is submitted to two separate queues.
NVIDIA GeForce GTX 970
Here is the corresponding trace taken on an NVIDIA GTX 970, with async compute disabled in Time Spy benchmark settings. Again we can see that there is only one queue.
NVIDIA GeForce GTX 1080

Finally, here is a corresponding trace taken on an NVIDIA GeForce GTX 1080. As you can see, the extra COMPUTE queue from the previous trace is gone. From this image we see that, as on the Radeon Fury, when we do not create a separate COMPUTE queue then no automatic separation and submission of tasks by the driver will occur.
In all these situations we can see a clear difference when the benchmark forces all work into the same DIRECT queue, or when we populate both DIRECT and COMPUTE queues.
Summary
Asynchronous compute is one of the most interesting new features in DirectX 12. The work that Time Spy places into the COMPUTE queue and the specific implementation of that work is the result of deep co-operation with all BDP members including AMD, Intel, Microsoft, and NVIDIA among others.
The implementation is the same regardless of the underlying hardware. In the benchmark at large, there are no vendor specific optimizations in order to ensure that all hardware performs the same amount of work. This makes benchmark results from all vendors comparable across multiple generations of hardware.
Whether work placed in the COMPUTE queue is executed in parallel or in serial is ultimately the decision of the underlying driver. In DirectX 12, by placing items into a different queue the application is simply stating that it allows execution to take place in parallel - it is not a requirement, nor is there a method for making such a demand. This is similar to traditional multi-threaded programming for the CPU - by creating threads we allow and are prepared for execution to happen simultaneously. It is up to the OS to decide how it distributes the work.
For benchmarks to be relevant and useful tools, they must be fair, impartial, and unbiased. This is why 3DMark Time Spy, and all other Futuremark benchmarks, are developed with industry-leading hardware and software partners through our Benchmark Development Program using a process that's been government vetted for fairness and neutrality. This process ensures that our benchmarks are accurate, relevant, and impartial.
We take pride in creating the world’s best and most popular benchmarking software. We also hope our openness in providing this detailed description of new DirectX features, and how we utilize them, has been informative and interesting.
If you have a question about Time Spy, please contact our Director of Engineering, Jani Joki at jani.joki@ul.com, We always aim to be transparent in our implementation and our process, and we're happy to explain any aspect that hasn't been covered here.
Recent news
-
Announcing our next generation 3DMark GPU Benchmark and its first sponsor
June 3, 2026
-
Launching Procyon Essentials: a browser-focused benchmark for multitasking professionals
May 5, 2026
-
3DMark on MacOS now available directly from UL Solutions.
April 22, 2026
-
3DMark delisting of REDMAGIC 11 Pro phones
April 9, 2026
-
Introducing Computer Vision 2.0, Our Next‑Generation AI Hardware Benchmark
March 30, 2026
-
Procyon® AI Benchmarks Provide Full Coverage and Actionable Performance Insights
January 13, 2026
-
Procyon Labs launches with FLUX.1 AI Image Generation Demo
November 4, 2025
-
3DMark Solar Bay Extreme is available now!
August 20, 2025
-
3DMark Speed Way Teams up with PC Building Simulator 2!
July 17, 2025
-
New Procyon AI Benchmark for Macs now available
June 25, 2025
-
3DMark for macOS available now!
June 12, 2025
-
New Inference Engines now available in Procyon
May 1, 2025
-
Try out NVIDIA DLSS 4 in 3DMark
January 30, 2025
-
Test LLM performance with the Procyon AI Text Generation Benchmark
December 9, 2024
-
New DirectStorage test available in 3DMark
December 4, 2024