New cross-platform benchmark for Android, iOS and Windows
October 15, 2020

We're thrilled to announce the release of 3DMark Wild Life, a new cross-platform benchmark for comparing the graphics performance of the latest Apple, Android and Windows devices.
Wild Life offers two ways to test mobile devices: a quick benchmark that measures instant performance and a longer stress test that shows you how your device performs under longer periods of heavy load.
3DMark Wild Life is available now for Android, iOS and Windows.
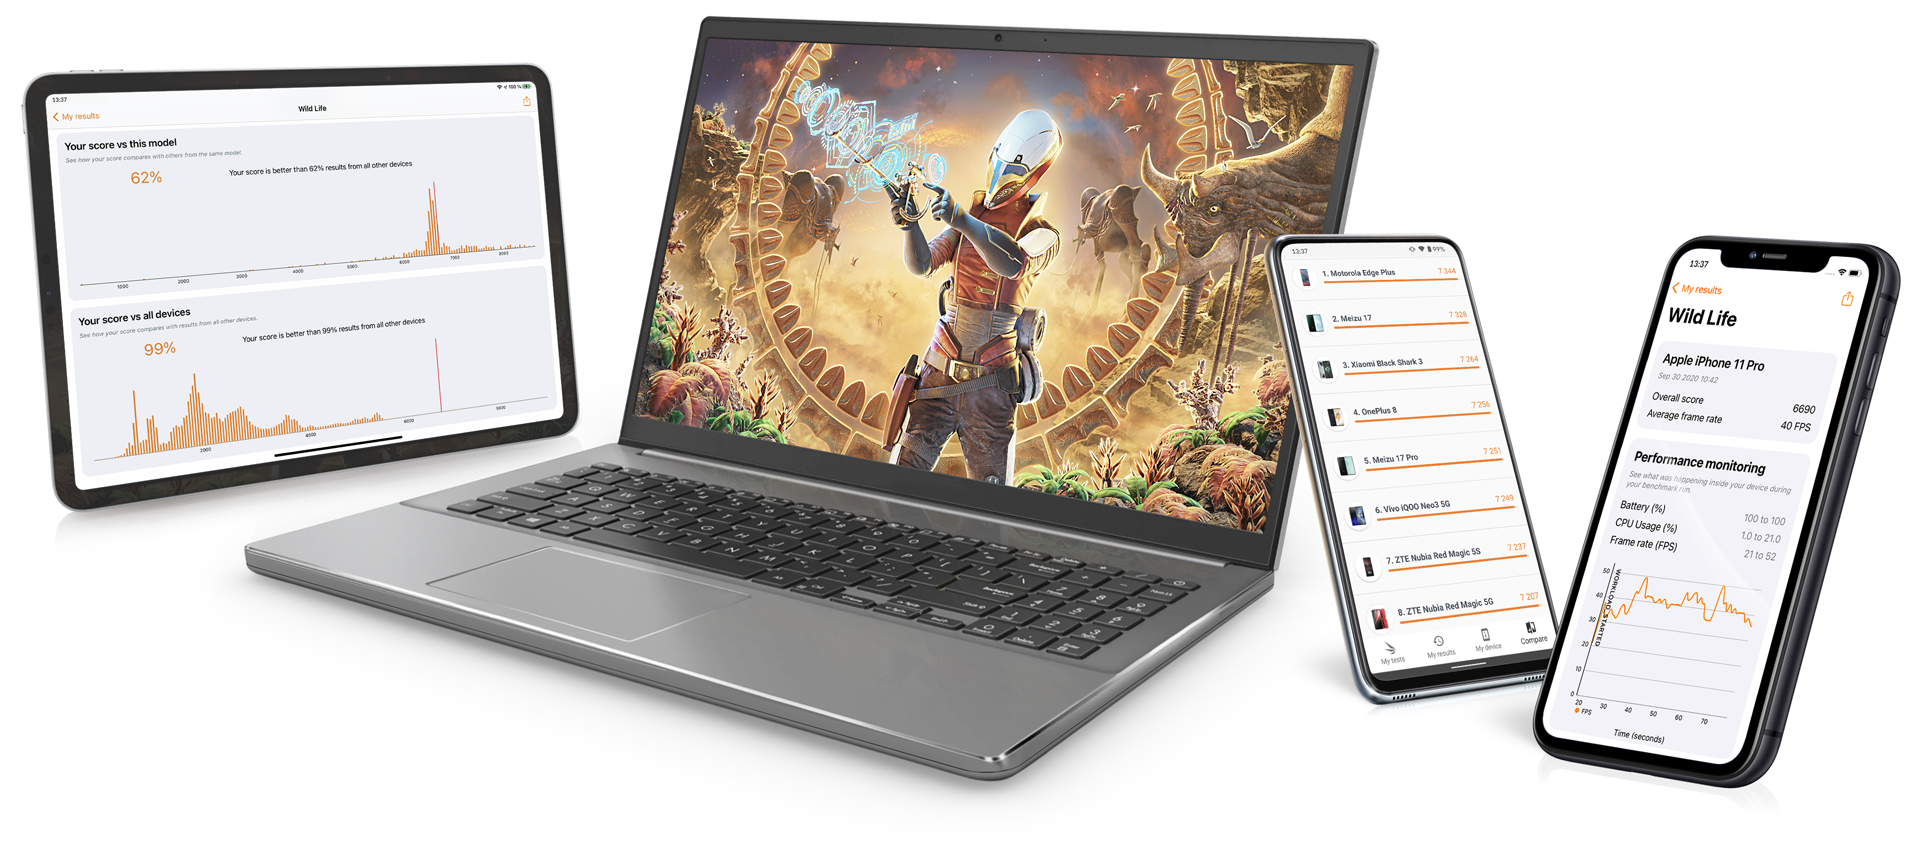
3DMark Wild Life, a cross-platform GPU benchmark
3DMark Wild Life is a new cross-platform benchmark for Apple, Android and Windows devices. You can use 3DMark Wild Life to test and compare the graphics performance of the latest smartphones, tablets and notebooks.
Wild Life measures GPU performance by rendering a demanding game-like scene in real time. The faster the scene runs, the higher your benchmark score.
3DMark Wild Life shows the advanced rendering techniques and post-processing effects that are possible on modern mobile devices. Wild Life uses the Vulkan API on Android devices and Windows PCs. On iOS devices, it uses the Metal API.
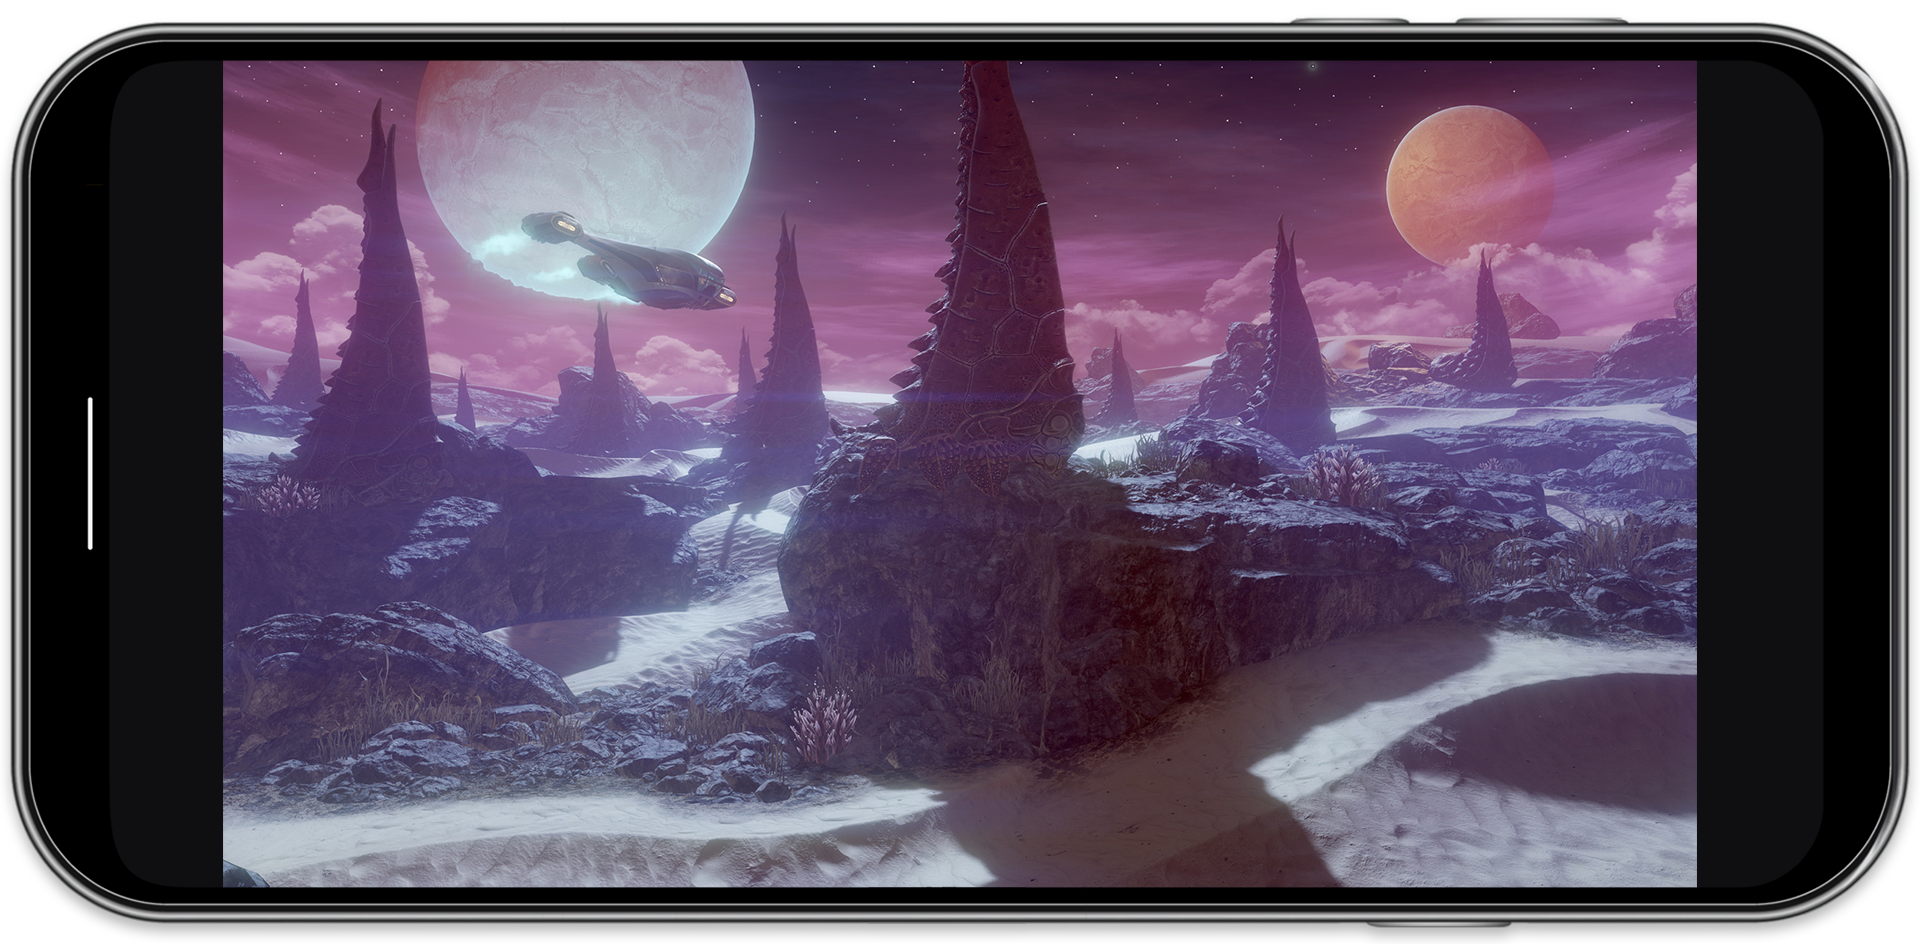
Two ways to test GPU performance
Run the 3DMark Wild Life benchmark to measure a device's ability to provide instant performance for a short period of time. This test mirrors mobile games in which the gameplay loop is a series of short bursts of activity.
The 3DMark Wild Life Stress Test is a longer test that shows how a device performs under longer periods of heavy load. It mirrors mobile games in which the gameplay loop is a longer, more immersive experience. Instead of producing a single score, the main result from the stress test is a chart that shows you how the device’s performance changed during the test. This chart can help you understand how your device manages performance and heat during heavy use.
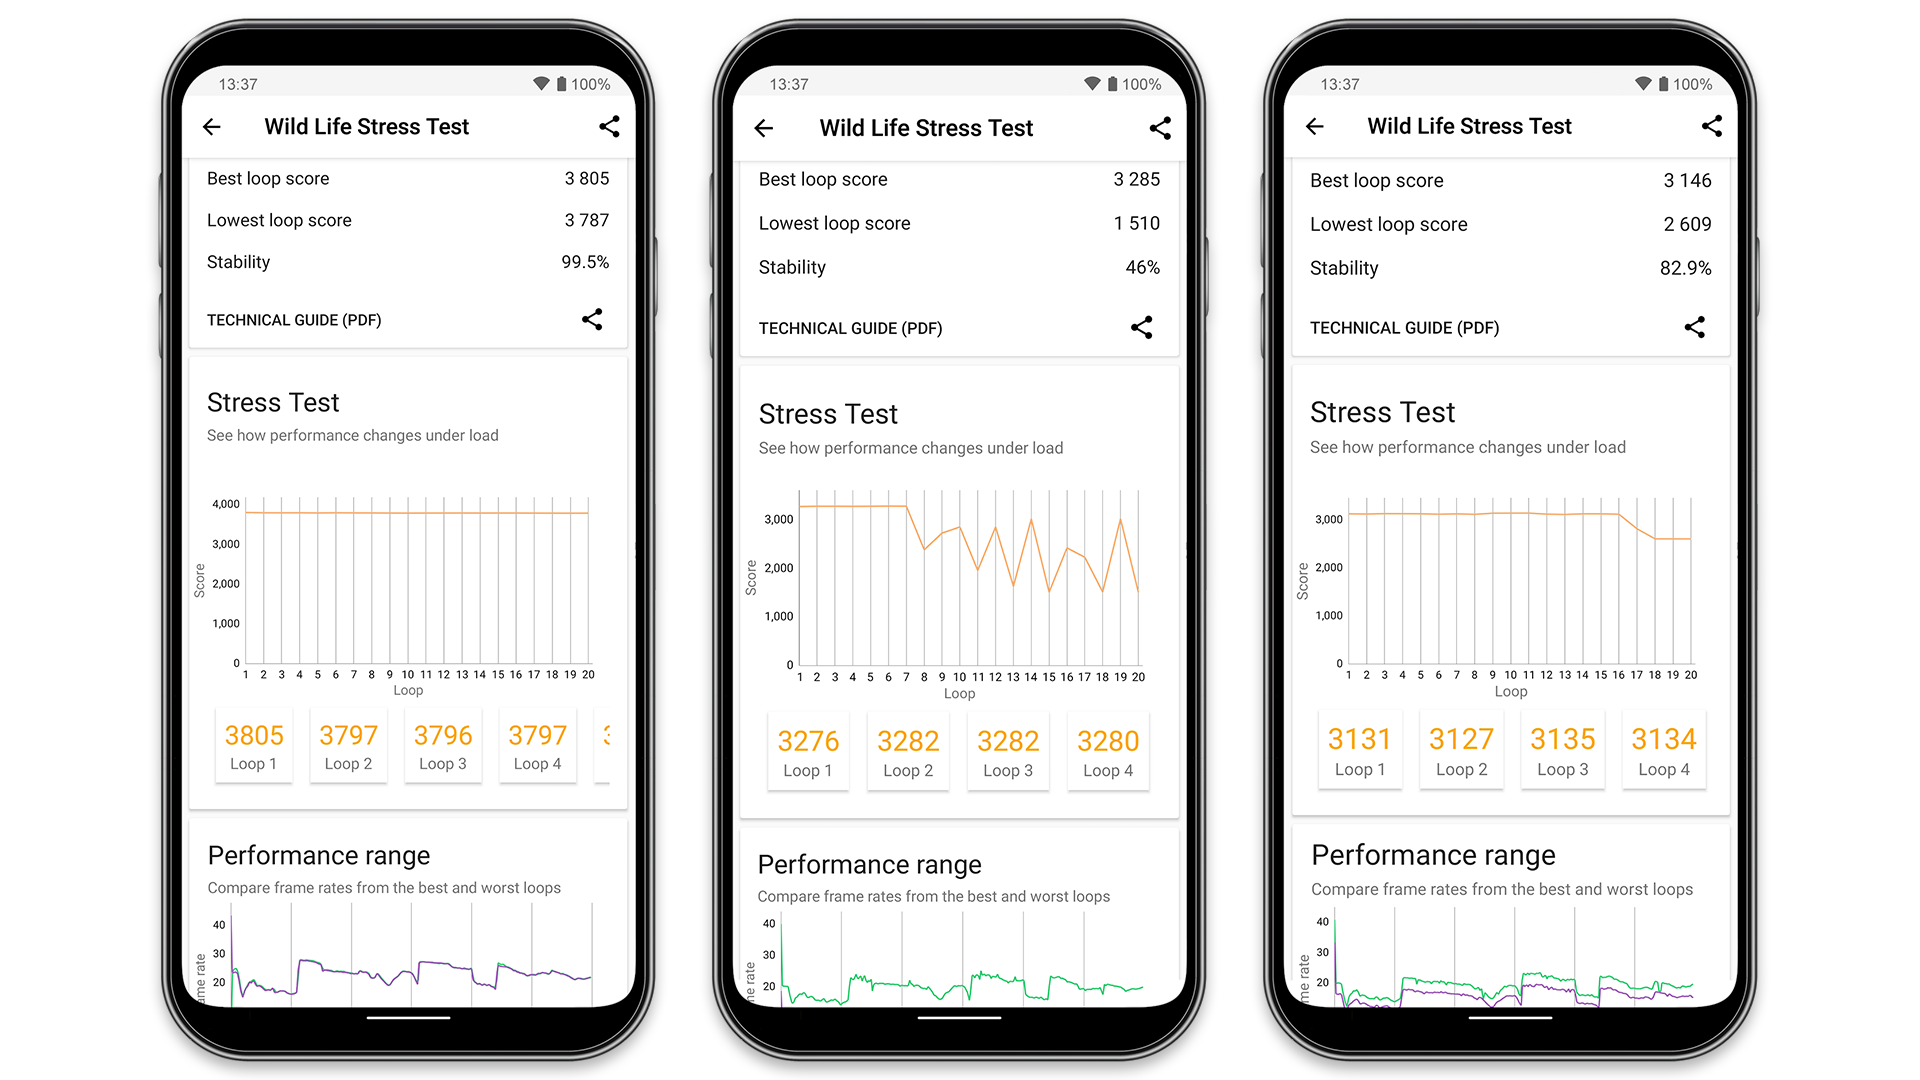
The first screenshot on the left in the image above shows a device that offers steady performance with no throttling. The middle screenshot shows aggressive performance throttling after a short time due to heat build-up under heavy load. The last screenshot on the right shows gradual throttling down from the peak to a lower level of sustained performance.
The benchmark that gives you more than a score
3DMark is a benchmarking app that gives you more than a score. With its unique charts, lists and rankings, 3DMark gives you unrivaled insights into the performance of Android and iOS devices.
Discover real-world performance
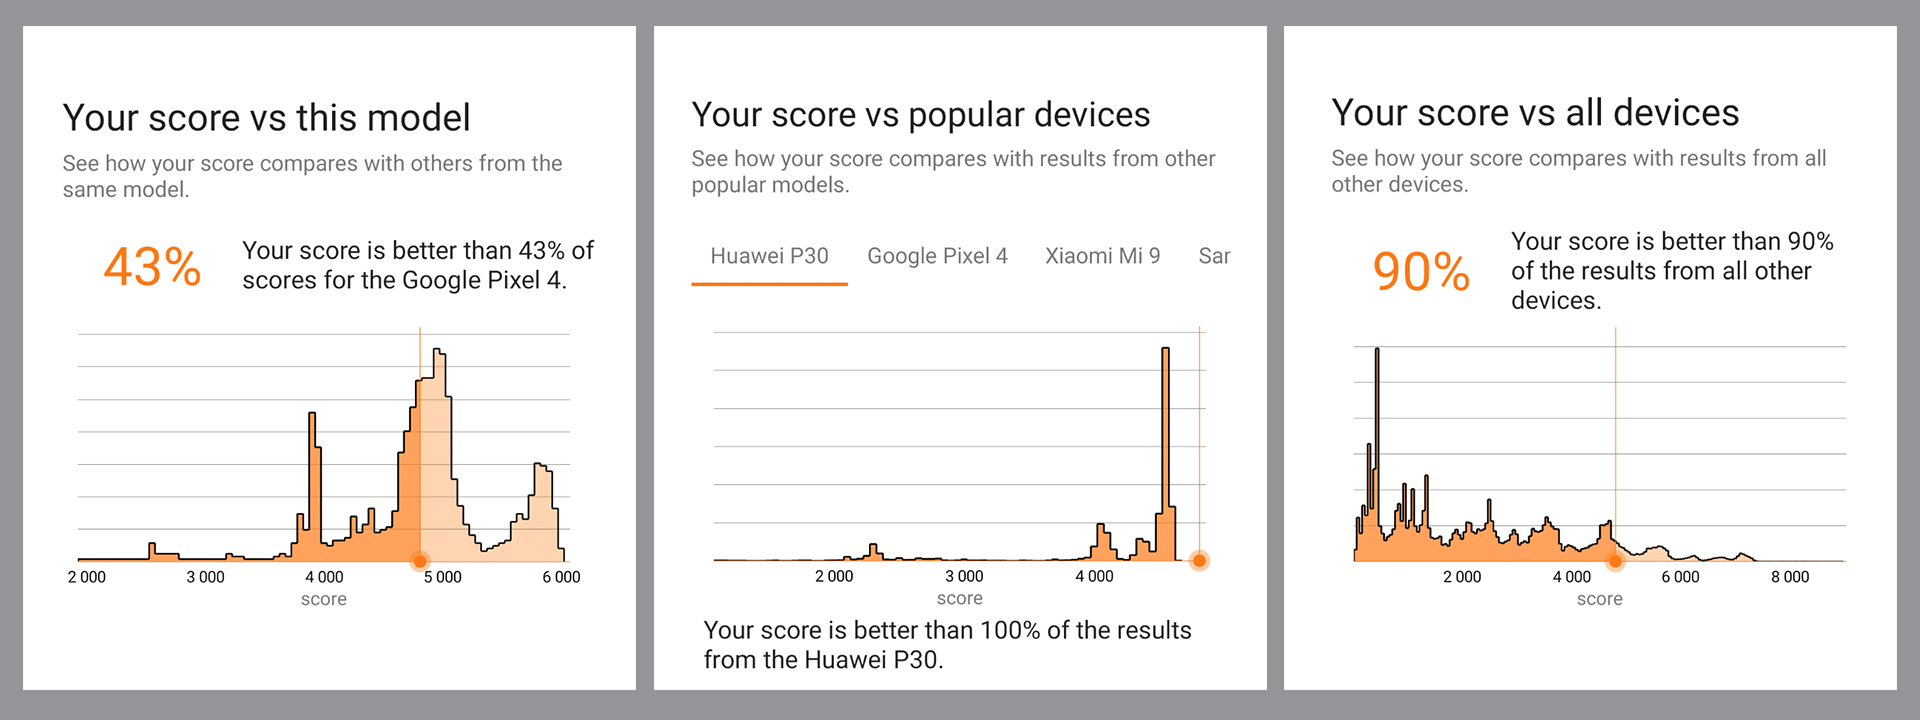
Average benchmark scores are good for comparing devices, but 3DMark goes further. For each device, a unique chart shows you the full range of results submitted by other 3DMark users around the world.
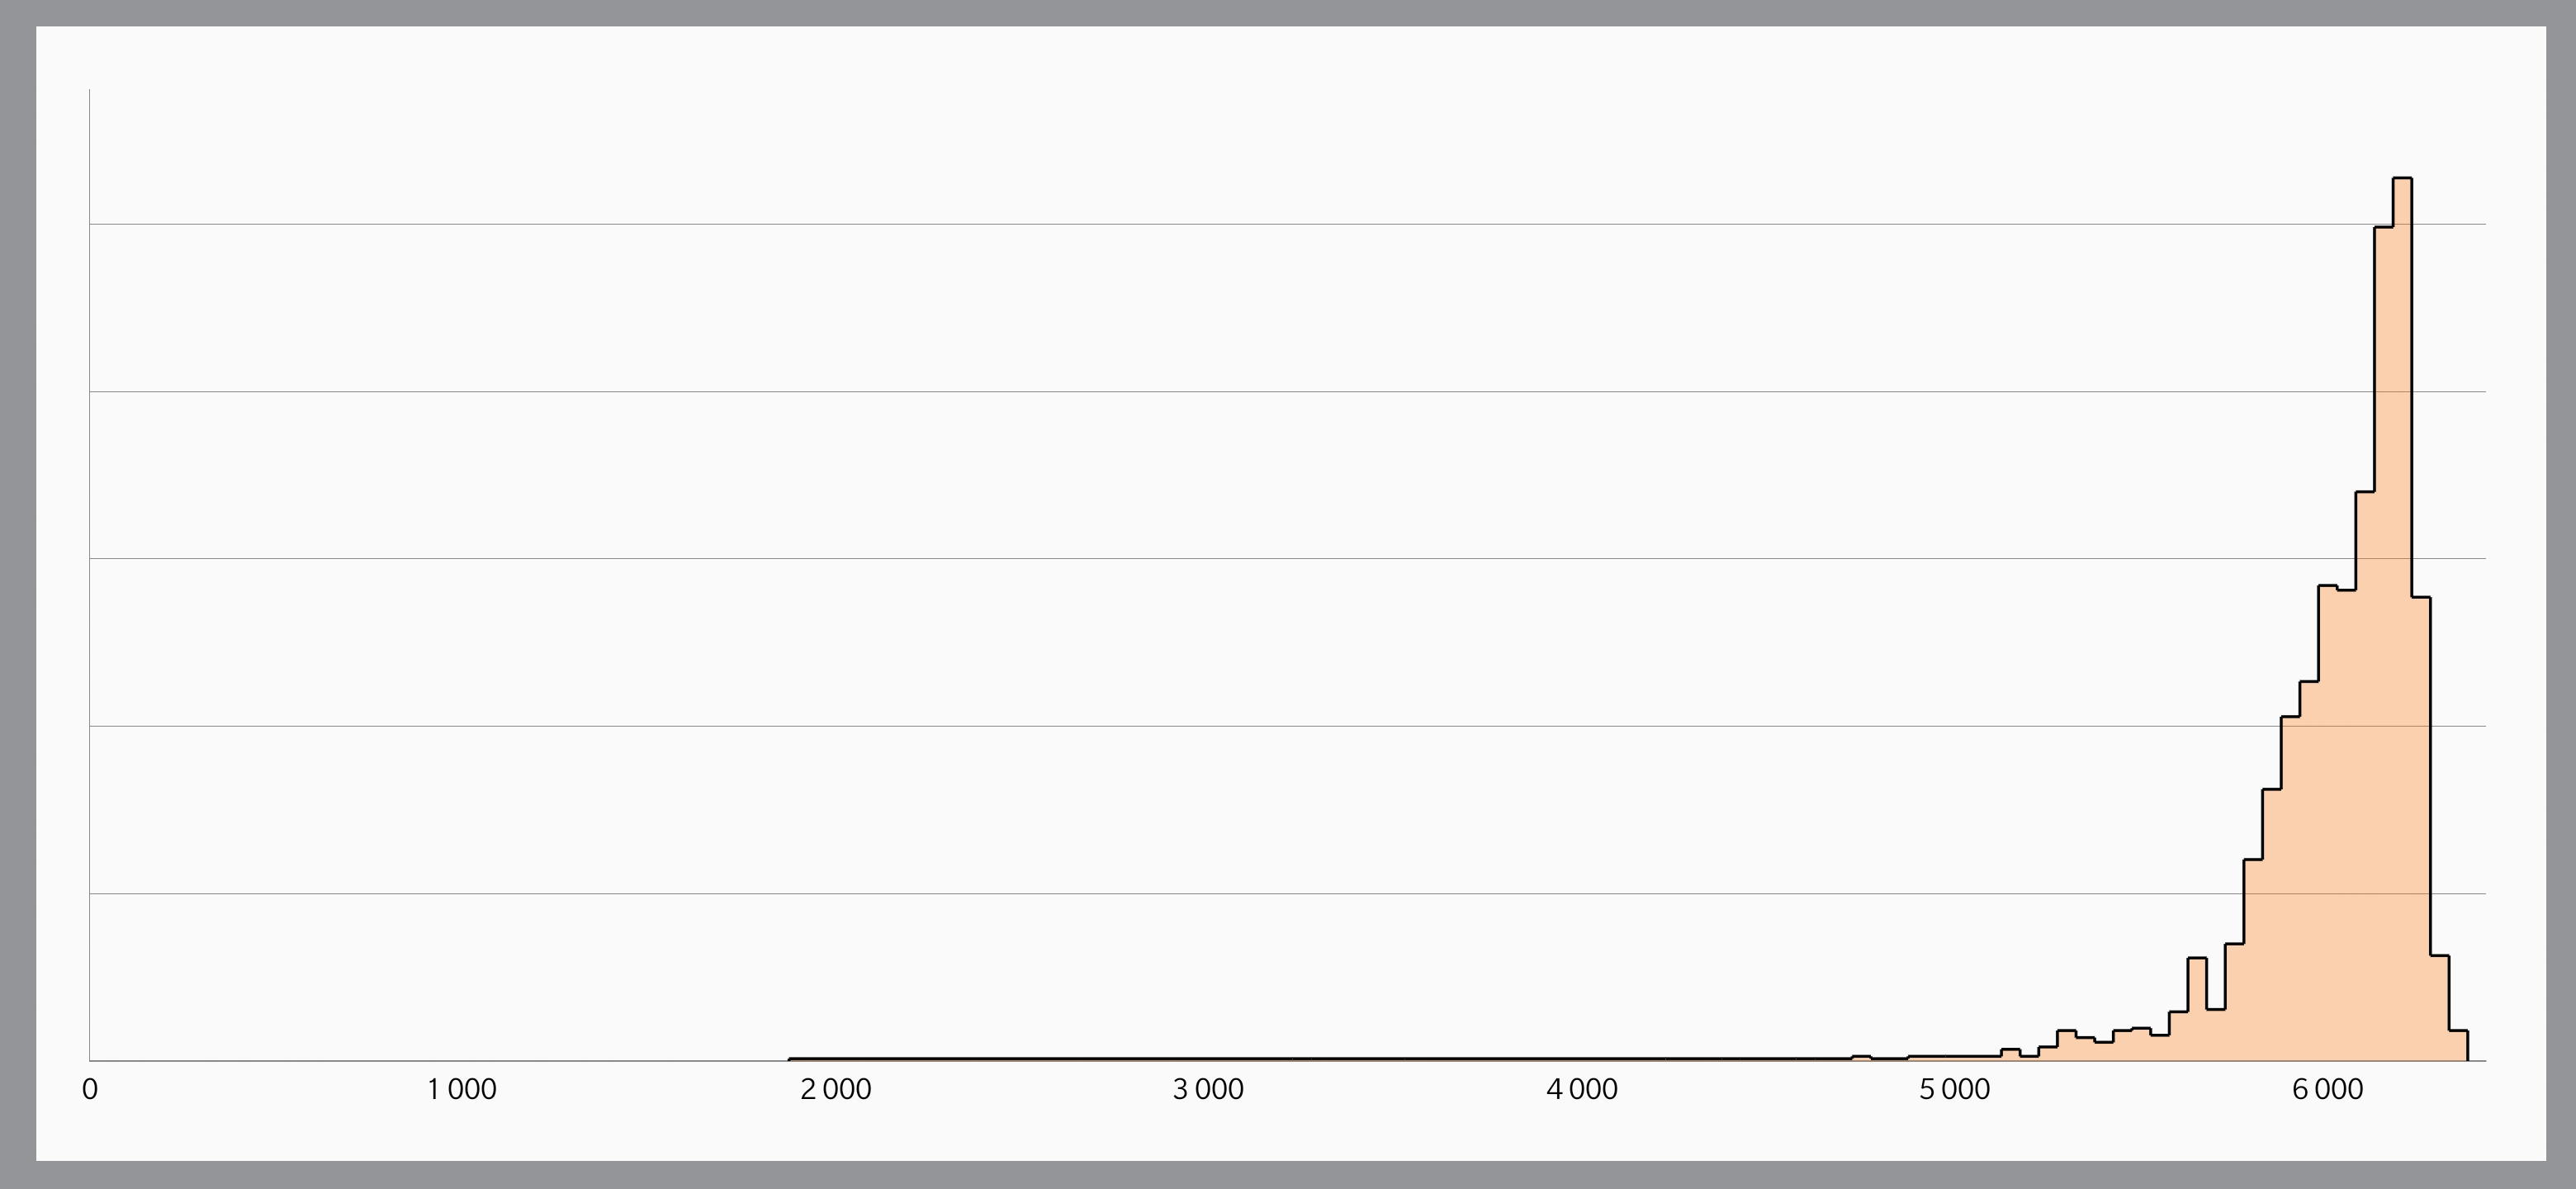
In the chart below, for example, you can see that all the results tend to fall in the same narrow range. This means the device performs consistently even when the benchmark is running under less than ideal conditions.
The next chart, however, shows a different performance profile. There are four distinct peaks spread over a wide range of scores. A chart with this shape tells you that the device does not perform consistently in real-world use.
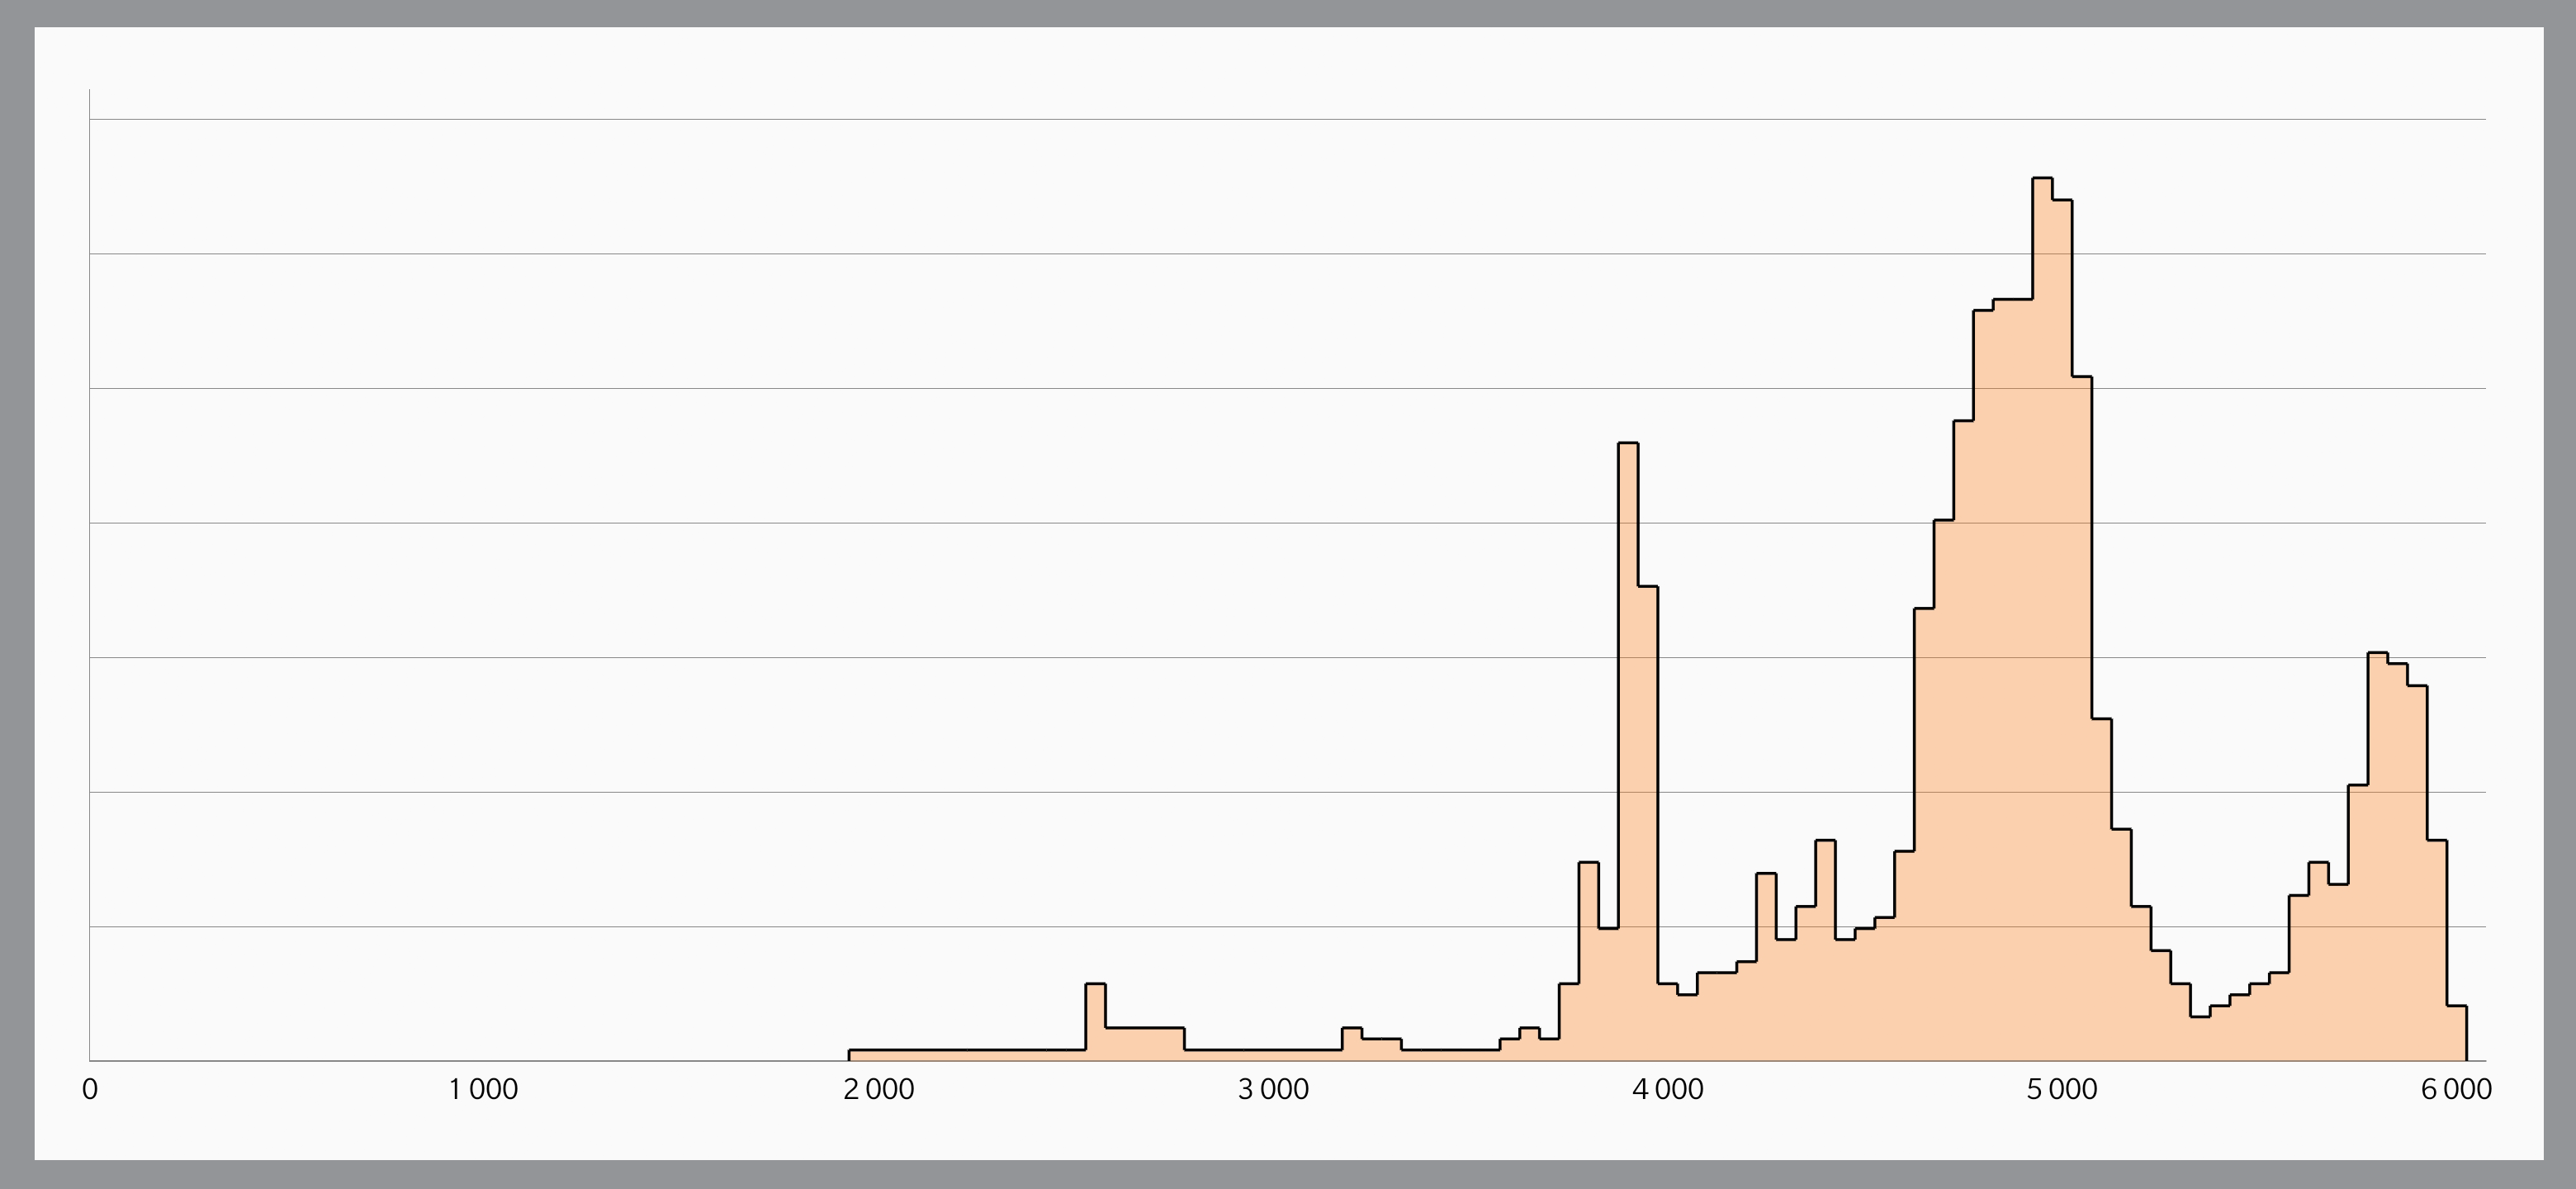
The rightmost peak shows the score the device can achieve under ideal conditions. The two middle peaks tell you that this device slows down when hot or when multitasking. Many devices tend to reduce performance in steps, and those steps are visible in the chart. The leftmost peak shows you that the device's real-world performance can sometimes be far below the optimum.
See how OS updates affect performance
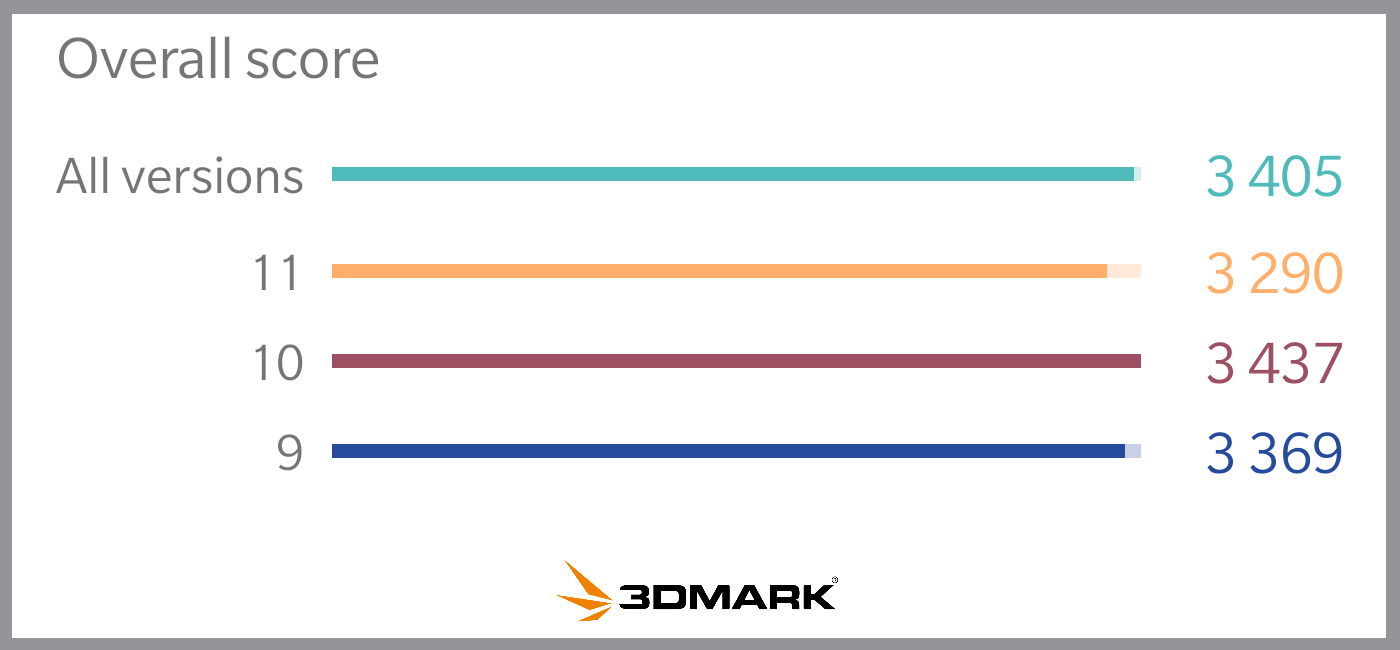
With 3DMark, it’s also easy to see how major OS updates—like Android 11 and iOS 14—affect the performance of a device. All charts and rankings are updated daily as new benchmark results come in.
Download the 3DMark app for Android devices
Wild Life is available now as a free update for the 3DMark Android app from Google Play. You need Android 10 or later to run the Wild Life benchmark.
Download the 3DMark Wild Life app for iOS devices
3DMark Wild Life is available as a free, standalone app from the Apple App Store. Compatibility starts with the iPhone 6s and runs to the latest models. You need iOS 13 or later to run the benchmark.
3DMark Wild Life for Windows PCs
Wild Life is available now as a free update for 3DMark Advanced Edition from Steam, the UL Benchmarks website and now from the Green Man Gaming store.
Wild Life is available as a free update for 3DMark Professional Edition customers with a valid annual license. Customers with an older, perpetual license will need to purchase an annual license to unlock the Wild Life benchmark. Please contact us to request a quote.
Recent news
-
Procyon® AI Benchmarks Provide Full Coverage and Actionable Performance Insights
January 13, 2026
-
Procyon Labs launches with FLUX.1 AI Image Generation Demo
November 4, 2025
-
3DMark Solar Bay Extreme is available now!
August 20, 2025
-
3DMark Speed Way Teams up with PC Building Simulator 2!
July 17, 2025
-
New Procyon AI Benchmark for Macs now available
June 25, 2025
-
3DMark for macOS available now!
June 12, 2025
-
New Inference Engines now available in Procyon
May 1, 2025
-
Try out NVIDIA DLSS 4 in 3DMark
January 30, 2025
-
Test LLM performance with the Procyon AI Text Generation Benchmark
December 9, 2024
-
New DirectStorage test available in 3DMark
December 4, 2024
-
New Opacity Micromap test now in 3DMark for Android
October 9, 2024
-
NPUs now supported by Procyon AI Image Generation
September 6, 2024
-
Test the latest version of Intel XeSS in 3DMark
September 3, 2024
-
Introducing the Procyon Battery Consumption Benchmark
June 6, 2024
-
3DMark Steel Nomad is out now!
May 21, 2024