Enhancing 3DMark benchmark results with game performance data
November 25, 2020
We released a major update for 3DMark today that adds a new design for the benchmark results screen. With the new features we've added you can now:
- See how your 3DMark score compares with results from other systems with the same components.
- See the frame rates you can expect in a selection of popular games.
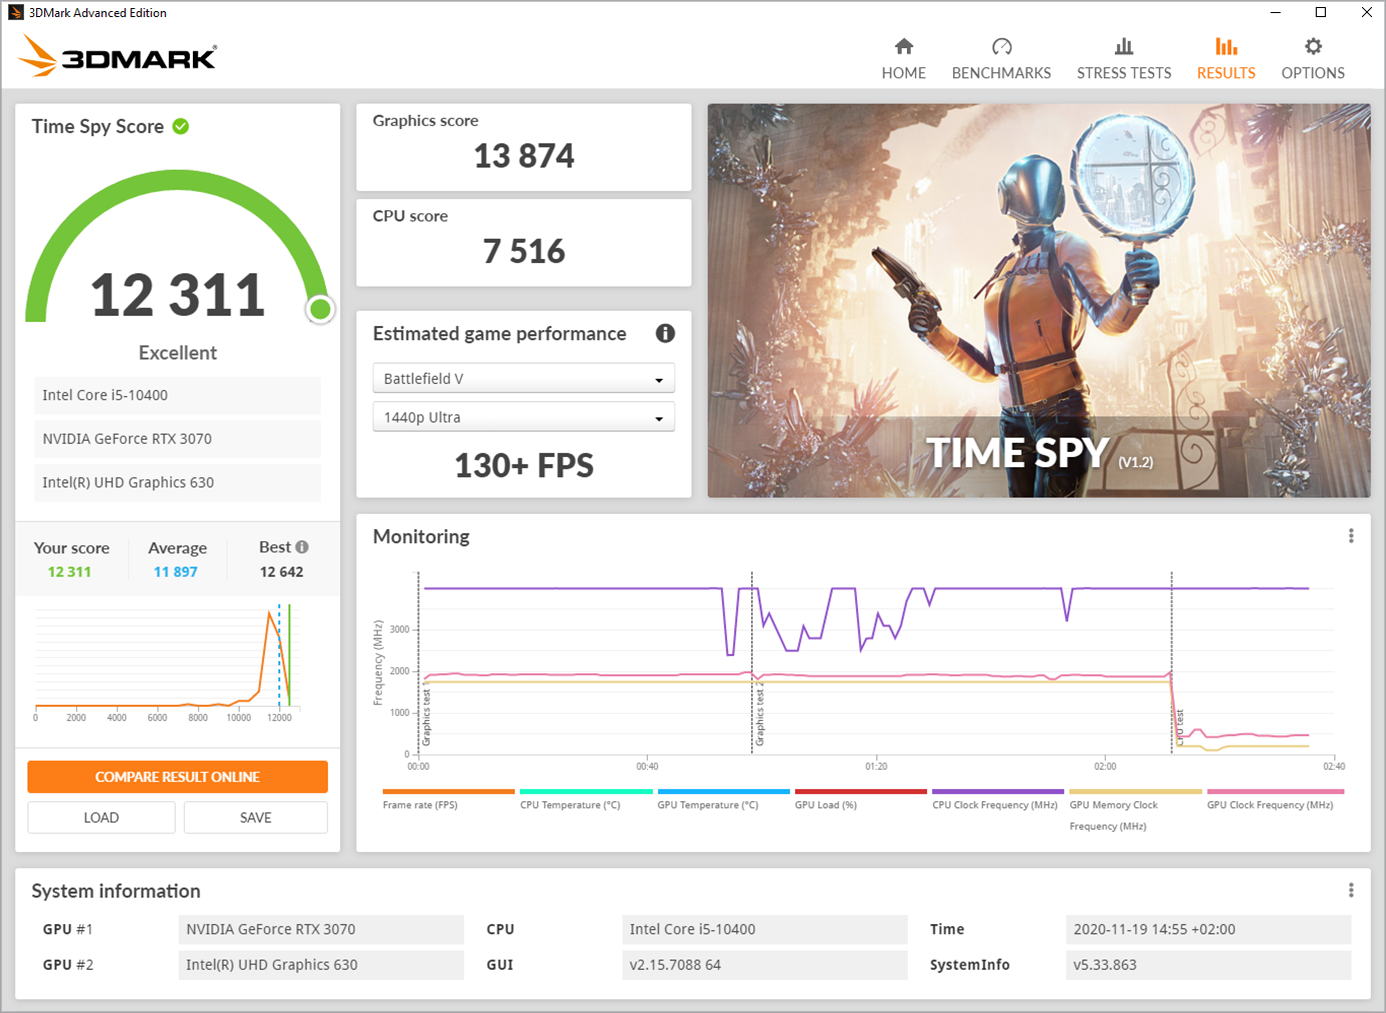
3DMark has a new result screen to help PC gamers make sense of their scores.
More than a score
With the launch of new graphics cards from AMD and NVIDIA, 3DMark is more popular than ever. PC gamers submitted more than one million benchmark results with 3DMark last month.
But we also see many gamers turning to forums and social media to ask for help with understanding their benchmark scores. That’s why we’ve spent the last few months redesigning the 3DMark result screen. We want to help gamers answer questions like, “Is this a good 3DMark score for my PC?” and “How does my 3DMark score relate to game performance?”
Learn more about your PC’s performance
3DMark now shows you how your benchmark score compares with results from other systems with the same components. This makes it easy to see if your PC is performing correctly.
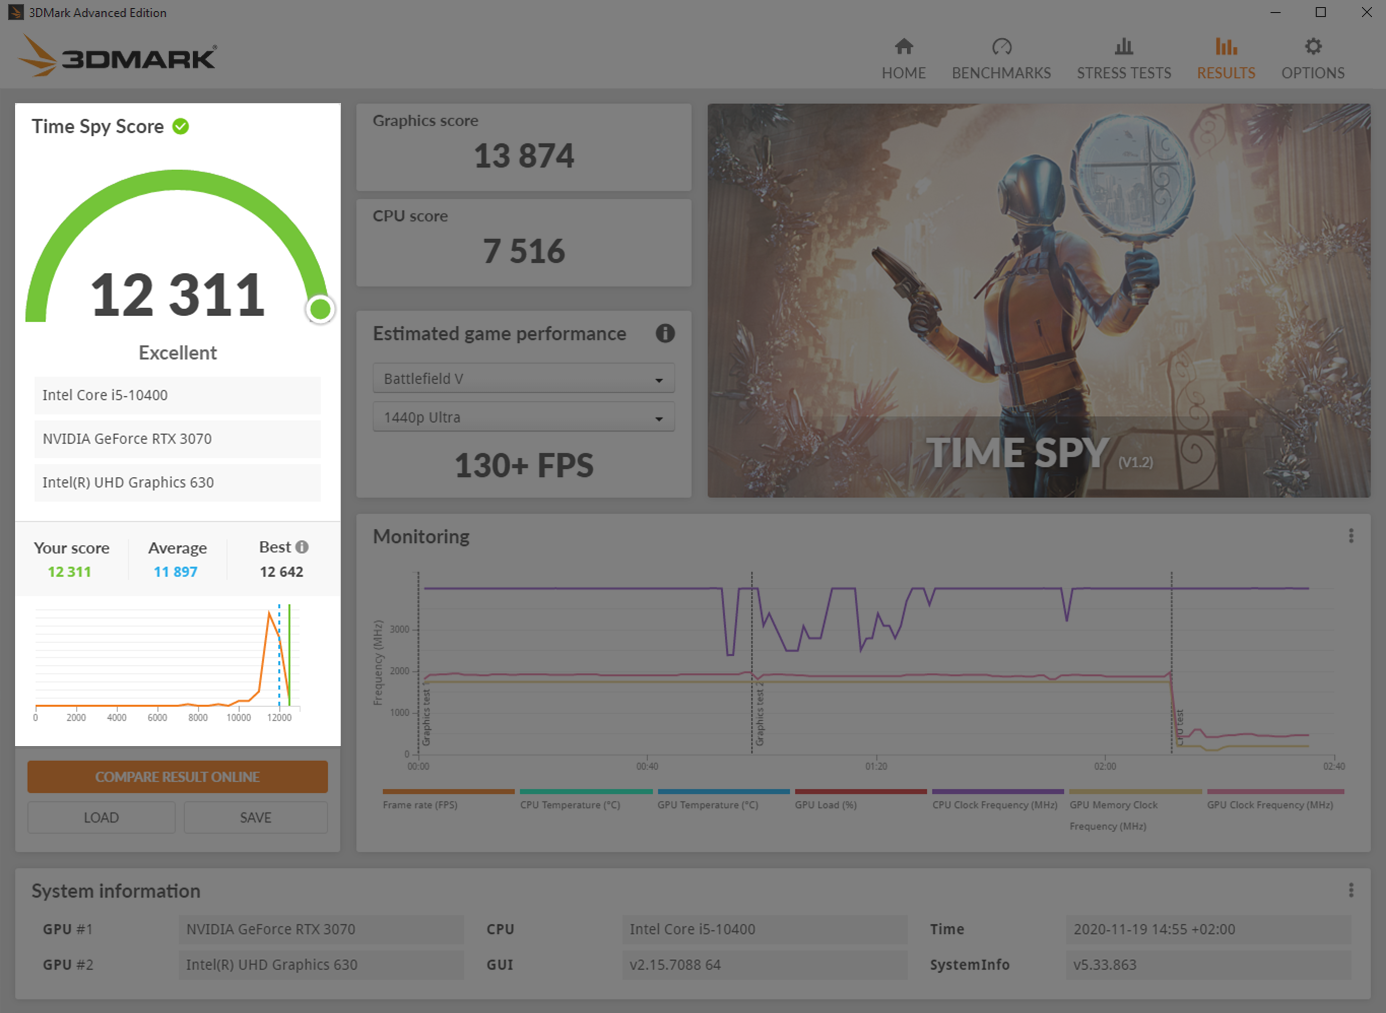
3DMark shows how your score compares with other results from the same hardware.
This new chart shows the range of scores submitted by other 3DMark users with the same combination of CPU and GPU.
The peaks in the chart show the most common scores. The green line shows your score. The blue, dotted line shows the average score for your combination of components.
If your score is close to the average, it means your PC is working as it should. A score well below the average could indicate a hardware or configuration problem. The best score gives you an idea of the overclocking potential of your setup.
Discover real-world game performance
3DMark helps you relate your 3DMark score to real-world game performance by estimating the frame rate you can expect in a selection of popular games. This is a major new feature in this update.
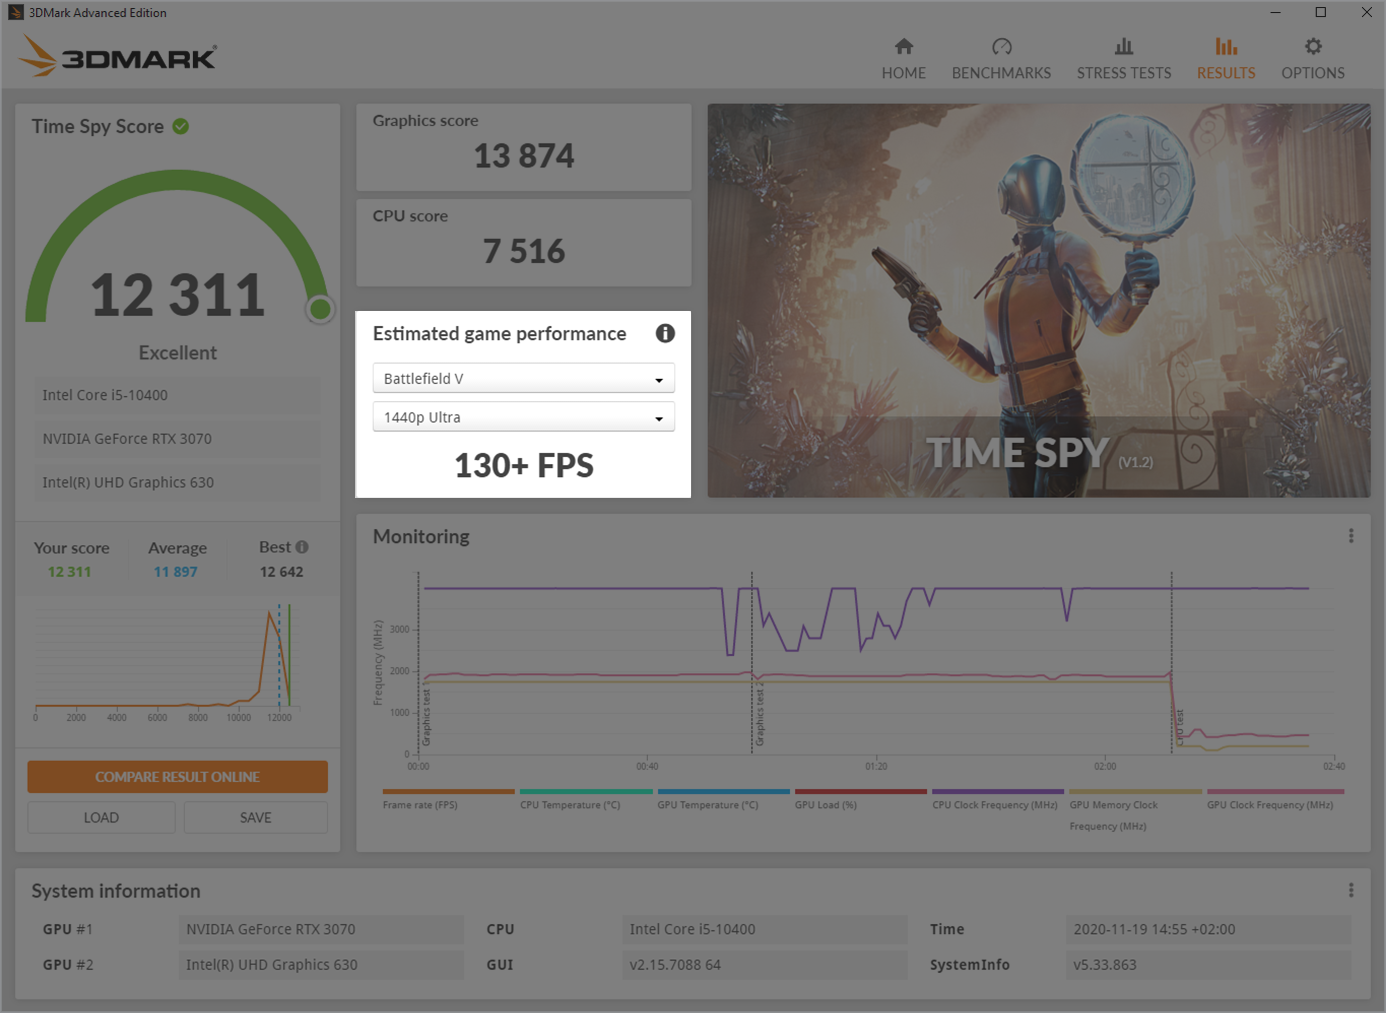
3DMark estimates game performance from your benchmark score.
This new part of the result screen shows estimated game performance based on your 3DMark score. In this first release, you can choose from five popular games:
- Apex Legends
- Battlefield V
- Fortnite
- GTA V
- Red Dead Redemption 2
For each game, you can choose either 1080p Ultra or 1440p Ultra settings. Ultra means using the game’s highest visual quality settings. Ray tracing options, if available, are turned off.
3DMark shows the average frame rate you can expect in the selected game. This frame rate is an estimate based on your 3DMark score and game testing performed by UL. Frame rates can vary within a game depending on the level or mode. Game updates, driver updates and system updates may also affect performance.
Estimating game performance from 3DMark scores
3DMark has always taken a game-like approach to benchmarking, but, in the past, it’s been hard for gamers to make the connection between 3DMark scores and game frame rates.
This new game performance feature is powered by extensive data from in-house testing. UL works with consumer electronics retailers to test and categorize PCs of all types. Every year, UL tests hundreds of PC systems for our retail partners. We test the performance of each system with a selection of benchmarks and popular games. Using this data, we can accurately model the relationship between 3DMark scores and game frame rates.
The chart below shows the relationship between 3DMark Time Spy Graphics score and average frame rate in Fortnite. Each orange dot shows the performance of a different PC system tested by UL.
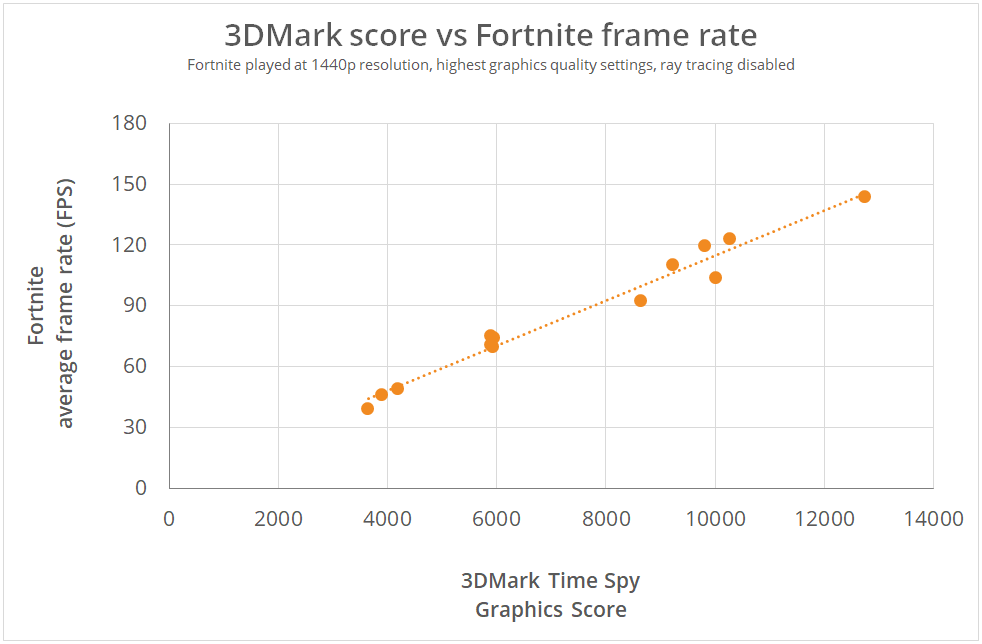
There is a strong correlation between 3DMark Time Spy Graphics Score and average frame rate in Fortnite.
You can see from the chart that a PC that scores 4,000 in the 3DMark Time Spy Graphics test can run Fortnite at 50 FPS on average at 1440p with the highest graphics quality settings. A 3DMark score of 6,000 translates to an average of 70 FPS in Fortnite. A score of 12,000 translates to 140 FPS.
It’s these correlations that enable 3DMark to estimate game frame rates. You can read more about estimating game performance from 3DMark scores on our website.

3DMark—The Gamer’s Benchmark
The new benchmark result screen is available now in all 3DMark editions. Game performance estimates are only available in 3DMark Advanced Edition and 3DMark Professional Edition.
Recent news
-
Seasonic joins as a sponsor of the next 3DMark GPU Benchmark
July 24, 2026
-
Announcing our next generation 3DMark GPU Benchmark and its first sponsor
June 3, 2026
-
Launching Procyon Essentials: a browser-focused benchmark for multitasking professionals
May 5, 2026
-
3DMark on MacOS now available directly from UL Solutions.
April 22, 2026
-
3DMark delisting of REDMAGIC 11 Pro phones
April 9, 2026
-
Introducing Computer Vision 2.0, Our Next‑Generation AI Hardware Benchmark
March 30, 2026
-
Procyon® AI Benchmarks Provide Full Coverage and Actionable Performance Insights
January 13, 2026
-
Procyon Labs launches with FLUX.1 AI Image Generation Demo
November 4, 2025
-
3DMark Solar Bay Extreme is available now!
August 20, 2025
-
3DMark Speed Way Teams up with PC Building Simulator 2!
July 17, 2025
-
New Procyon AI Benchmark for Macs now available
June 25, 2025
-
3DMark for macOS available now!
June 12, 2025
-
New Inference Engines now available in Procyon
May 1, 2025
-
Try out NVIDIA DLSS 4 in 3DMark
January 30, 2025
-
Test LLM performance with the Procyon AI Text Generation Benchmark
December 9, 2024