What's new in the Work 2.0 Android benchmark
October 7, 2016

Next week, on October 13, we will release a major update for our PCMark for Android benchmarking app. The update will add two new benchmark tests and an exciting new way to compare devices across Android OS versions. In this post, we'll be looking at the new and improved Work 2.0 benchmark and battery life test.
Each new generation of mobile devices is more powerful than the last. With the latest smartphones and tablets we can perform more tasks at home and work without needing a notebook or desktop PC.
The new Work 2.0 benchmark shows you how well your device handles common productivity tasks. It benchmarks performance and battery life with tests based on real applications using native APIs. Work 2.0 is an improved version of the original Work benchmark. It updates the Web Browsing, Writing, and Photo Editing tests and adds two all-new tests for Video Editing and Data Manipulation.
Video Editing test
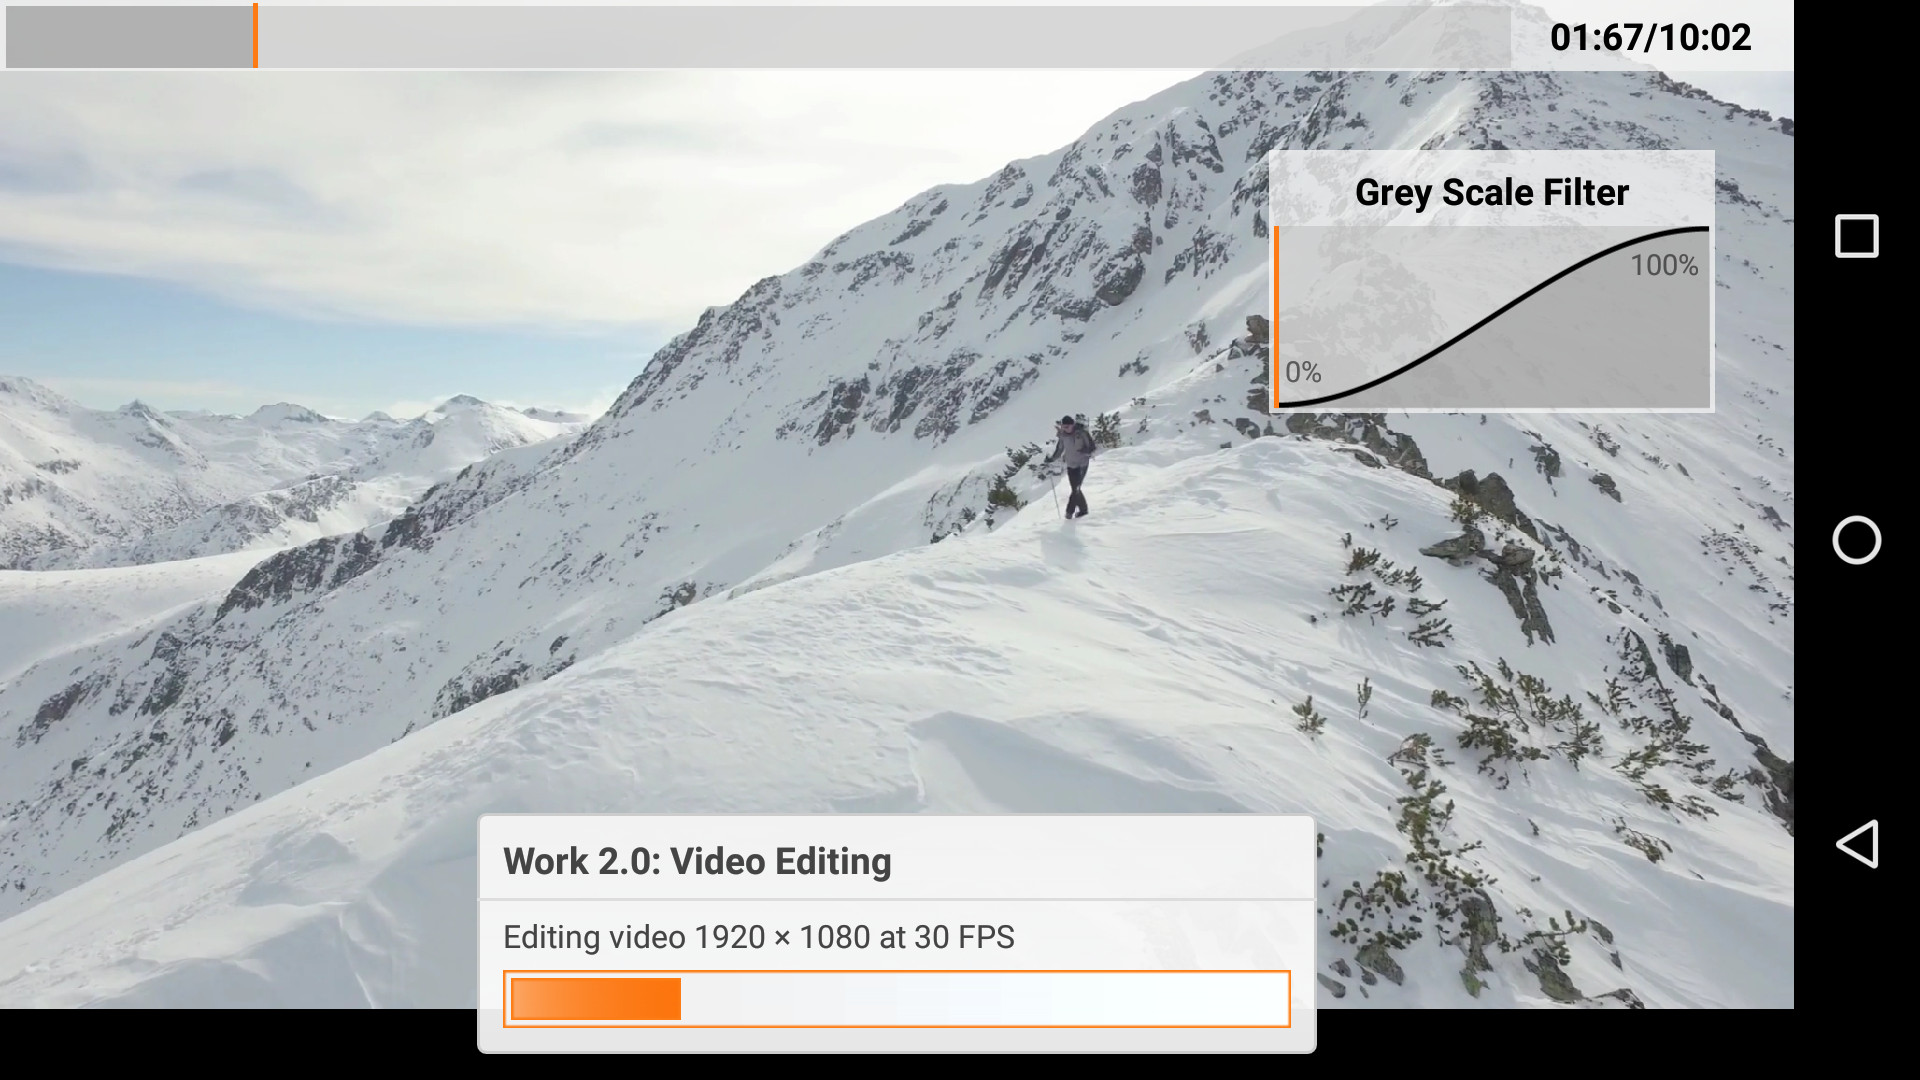
Combine a good-quality camera with decent processing power and your smartphone can act as a mobile movie studio. Mobile video editing apps help you trim and reorder clips, apply filters, and tweak the contrast and tone, before sharing your videos online.
The Video Editing test measures your device’s performance when playing, editing and saving video. The first part of the test measures how well your device performs when applying real-time effects to a number of video clips covering a range of common resolutions and frame rates. The second part of the test measures performance when decoding, editing, encoding and muxing a video.
The test uses OpenGL ES 2.0, the native Android MediaCodec API, and ExoPlayer, a Google-developed, open-source media player that improves on the native Android MediaPlayer API.
Data Manipulation test
There are now hundreds of apps that help us quantify our personal lives and work performance. We turn to fitness apps to analyse our workouts and monitor our health. We use personal finance apps to track our bank accounts, credit cards, and stock markets.
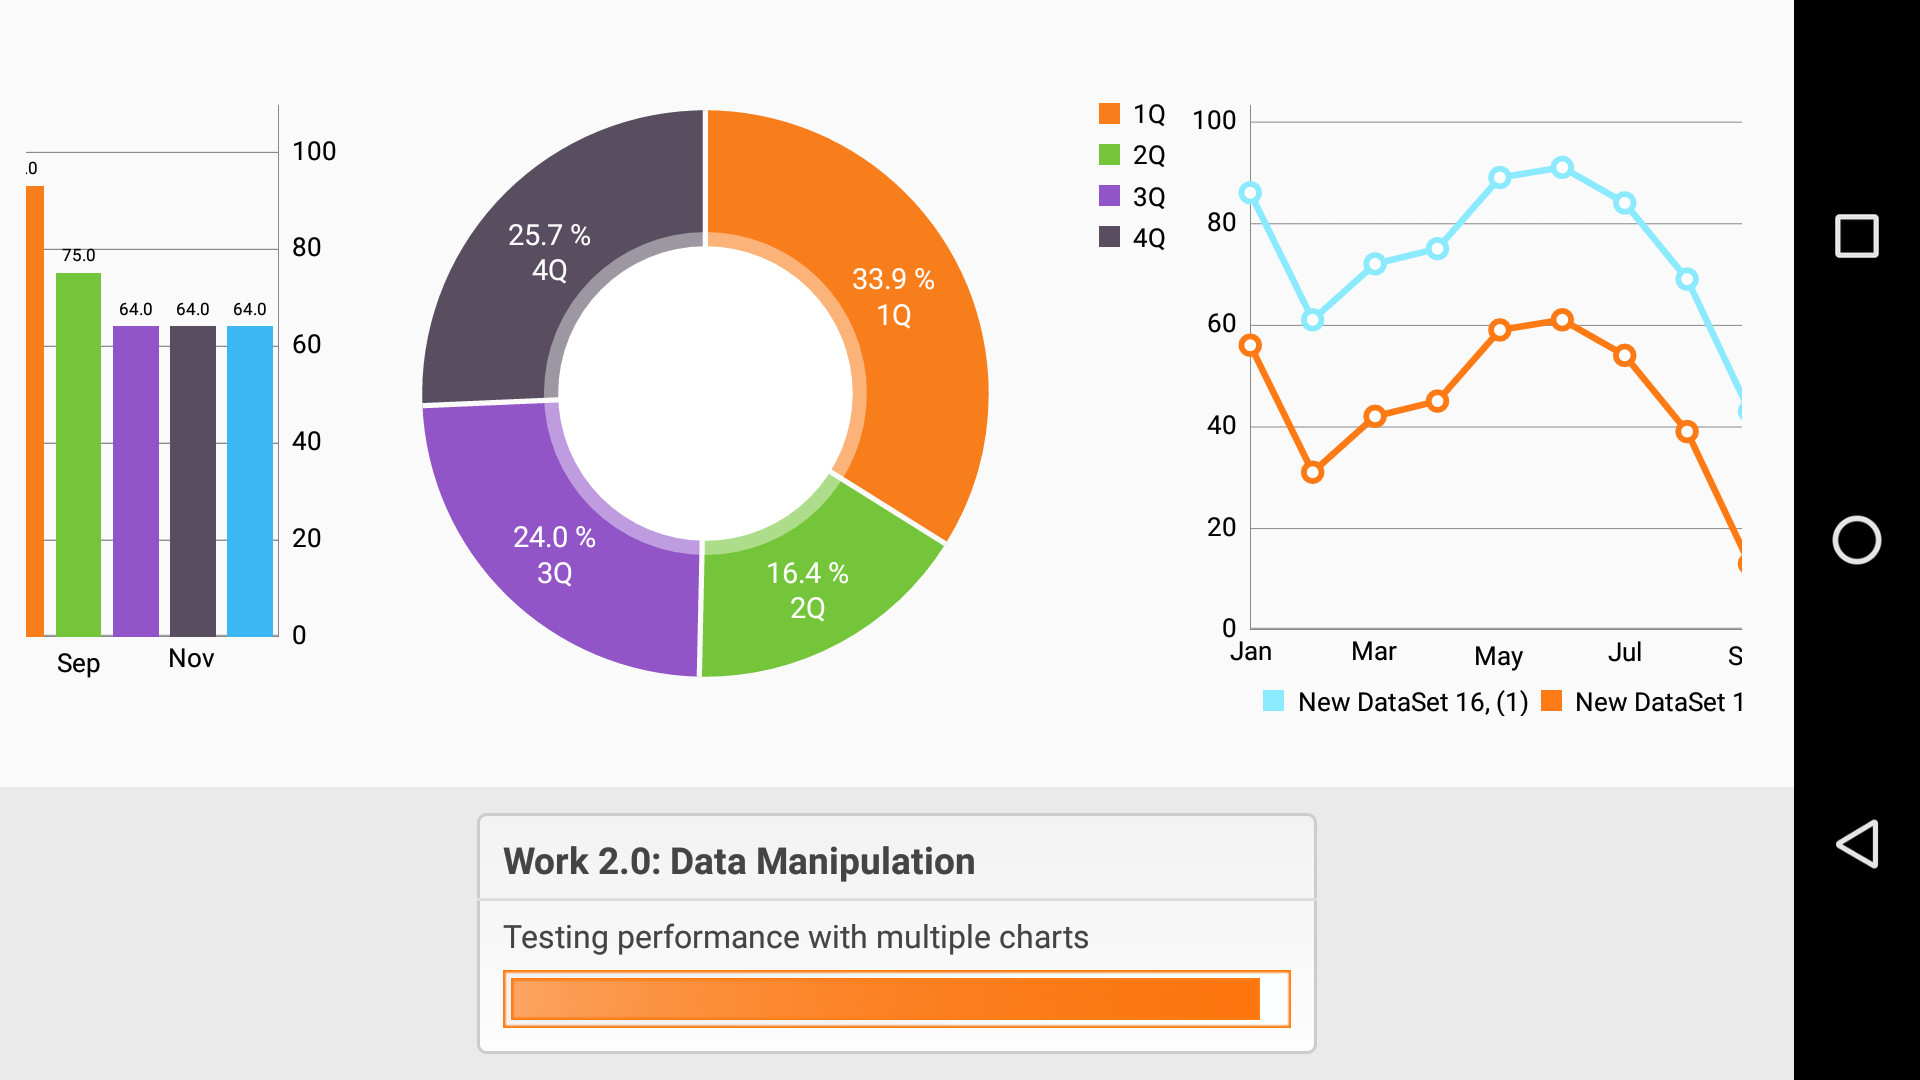
The new Data Manipulation test measures the time taken to parse data from various file formats, then records the frame rate while interacting with dynamic charts in real-time. Each test uses 10,000 tuples of data to create bar, line and pie charts, which are then animated in response to common gestures such as swipes and zoom.
Web Browsing 2.0 test
Did you know that more people now go online with smartphones than with PCs? Web Browsing 2.0 measures how well your device performs when displaying and interacting with web content. It tests performance when rendering a web page, scrolling, zooming, searching for content, and re-rendering the page after editing and adding an item.
Web Browsing 2.0 improves on the original Web Browsing test by measuring frame rate as well as the time taken to complete the tasks.
Writing 2.0 test
Tablets and smartphones with larger screens let you carry on working even when you're away from the office. The Writing 2.0 test measures how well your device performs when working with documents and text.
The Writing 2.0 test measures performance while adding text and images to a document and then cutting, copying, and pasting text within the document. Writing 2.0 expands on the original test by additionally measuring performance while creating, displaying, encrypting, and decrypting a PDF document.
Photo Editing 2.0 test
"The best camera is the one you have with you," says award-winning photographer, Chase Jarvis. No wonder more photos are taken on smartphones than cameras these days. Photography apps help us crop, fix, and filter our photos before we share them with friends.
The Photo Editing 2.0 test measures how well your device performs when applying various filters and effects to images. It measures the time taken to open, edit and save a set of images. The measurements include the time taken to move graphics data to and from the CPU and GPU, decode from and encode to JPEG format, and to read and write from the device’s storage.
Photo Editing 2.0 improves on the original test by using the latest android.renderscript API in place of the older android.support.v8.renderscript API that was used previously.
Work 2.0 battery life test
For many people, knowing that a phone will last through the day is the deciding factor when choosing a new model. After all, what use is great performance if it means you're always tethered to a charger?
Unfortunately, some manufacturers set battery life expectations too high by quoting figures based on unrealistic use cases. Measuring battery life with the real-world applications and activities in the Work 2.0 benchmark gives a much more realistic view of how long a device will last in everyday use.
"[PCMark is] one of my favorite battery benchmarks because it mixes together various different tasks, stresses different parts of the hardware, and in general gives a very good idea of how battery life will be when the user is doing many things with their smartphone." - Brandon Chester, Smartphone Editor at AnandTech
Work 2.0 benchmark score
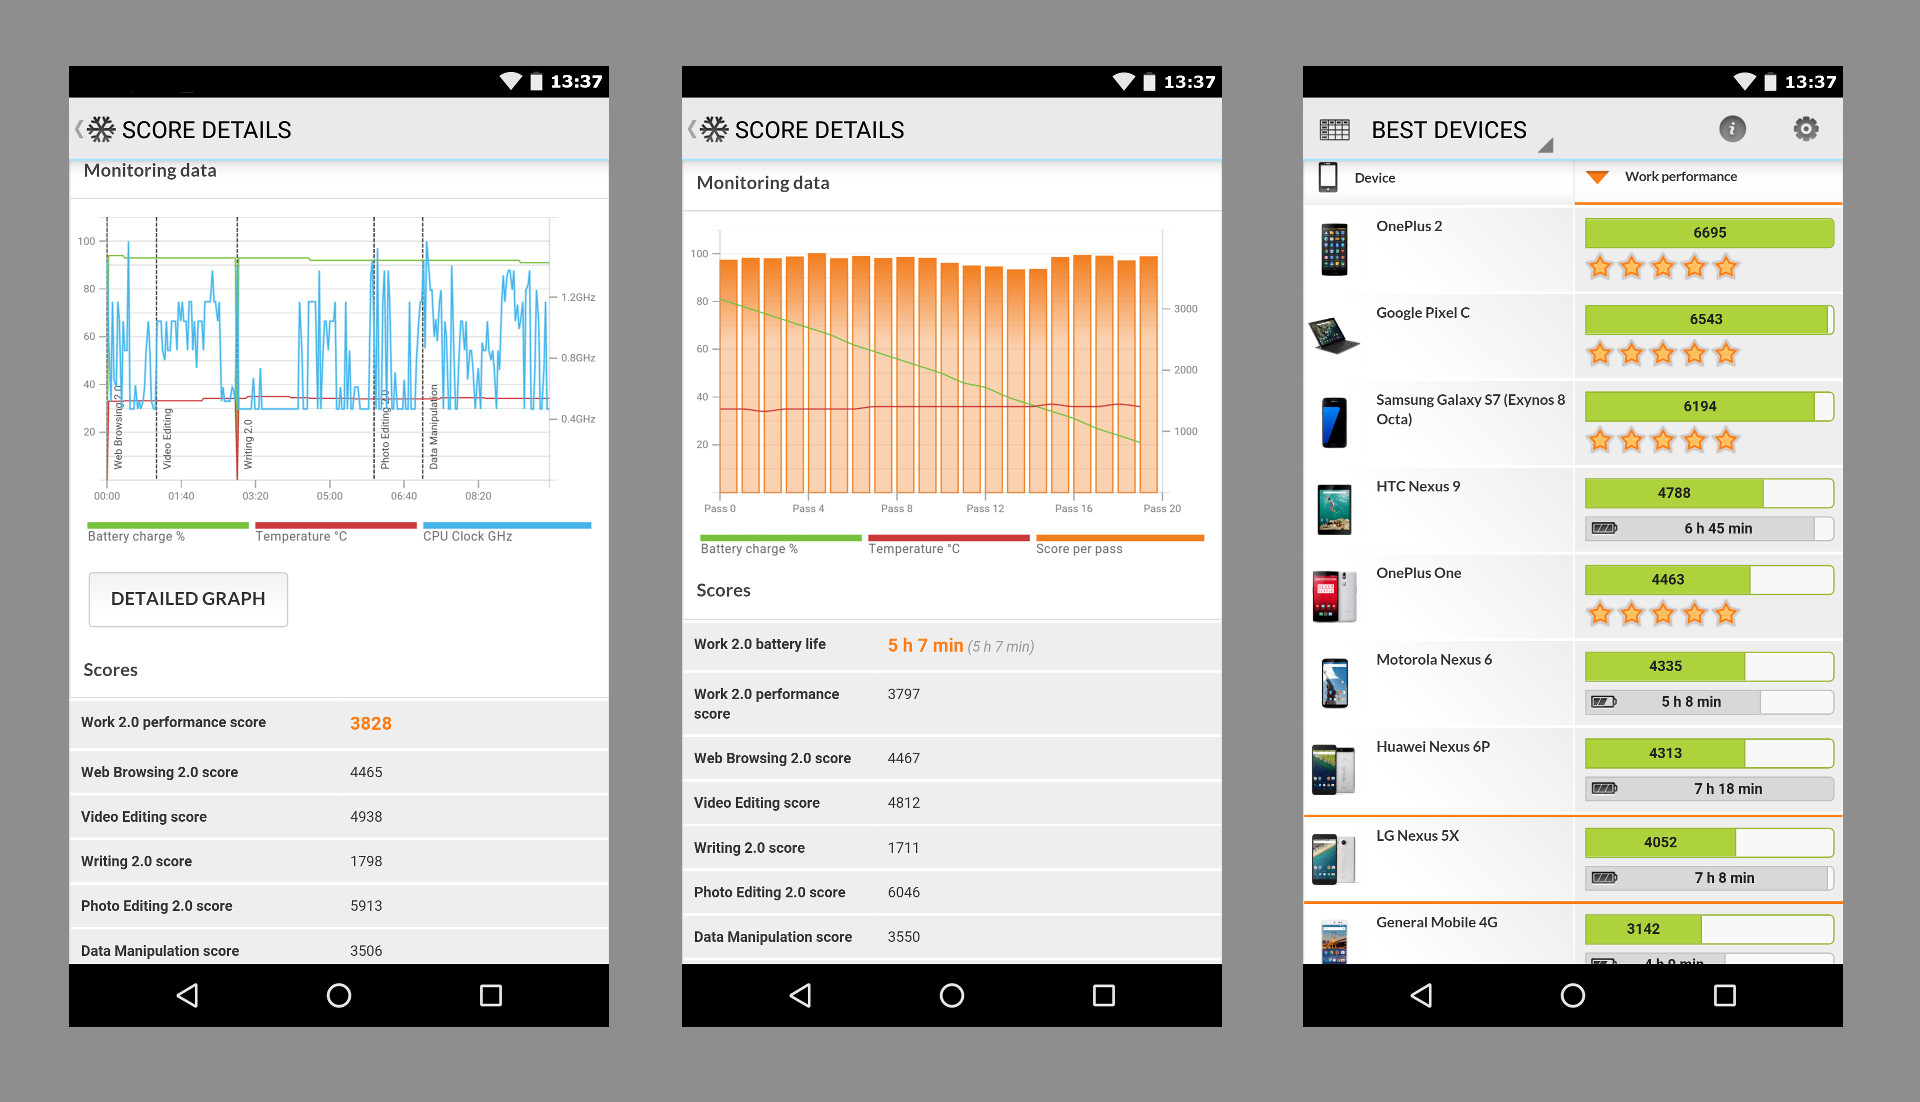
After running the Work 2.0 benchmark, you get an overall score and results from each of the subtests. Use these scores to compare your device with other smartphones or tablets. Detailed hardware monitoring charts show you how the CPU clock speed, temperature and battery charge level changed during the benchmark run. You can see how CPU scaling and thermal management affect your device's performance and battery life.
After running the Work 2.0 battery life test, you get the battery life result, an overall Work 2.0 performance score, and a chart showing the performance in each loop of the test. The chart makes it easy to see if the performance changed over time due to thermal issues or other factors.
The in-app Best Devices list is the ideal way to compare the performance, popularity and battery life of the latest Android smartphones and tablets. Tap any device to see a side-by-side comparison with your own device, or search for a specific model, brand, CPU, GPU or SoC.
Coming soon
PCMark for Android is a free benchmark app available now from Google Play. The Work 2.0 update will be available at 10:00 UTC on Thursday, October 13.
Recent news
-
Procyon® AI Benchmarks Provide Full Coverage and Actionable Performance Insights
January 13, 2026
-
Procyon Labs launches with FLUX.1 AI Image Generation Demo
November 4, 2025
-
3DMark Solar Bay Extreme is available now!
August 20, 2025
-
3DMark Speed Way Teams up with PC Building Simulator 2!
July 17, 2025
-
New Procyon AI Benchmark for Macs now available
June 25, 2025
-
3DMark for macOS available now!
June 12, 2025
-
New Inference Engines now available in Procyon
May 1, 2025
-
Try out NVIDIA DLSS 4 in 3DMark
January 30, 2025
-
Test LLM performance with the Procyon AI Text Generation Benchmark
December 9, 2024
-
New DirectStorage test available in 3DMark
December 4, 2024
-
New Opacity Micromap test now in 3DMark for Android
October 9, 2024
-
NPUs now supported by Procyon AI Image Generation
September 6, 2024
-
Test the latest version of Intel XeSS in 3DMark
September 3, 2024
-
Introducing the Procyon Battery Consumption Benchmark
June 6, 2024
-
3DMark Steel Nomad is out now!
May 21, 2024


