New 3DMark Android app gives you more than a score
December 18, 2017

We've redesigned our 3DMark Android benchmarking app with the goal of giving you much more than a score.
The new 3DMark app is built around data-driven stories that help you learn more about your smartphone or tablet. With its unique charts, lists, and rankings, the new app gives you unprecedented insight into the performance of your device.
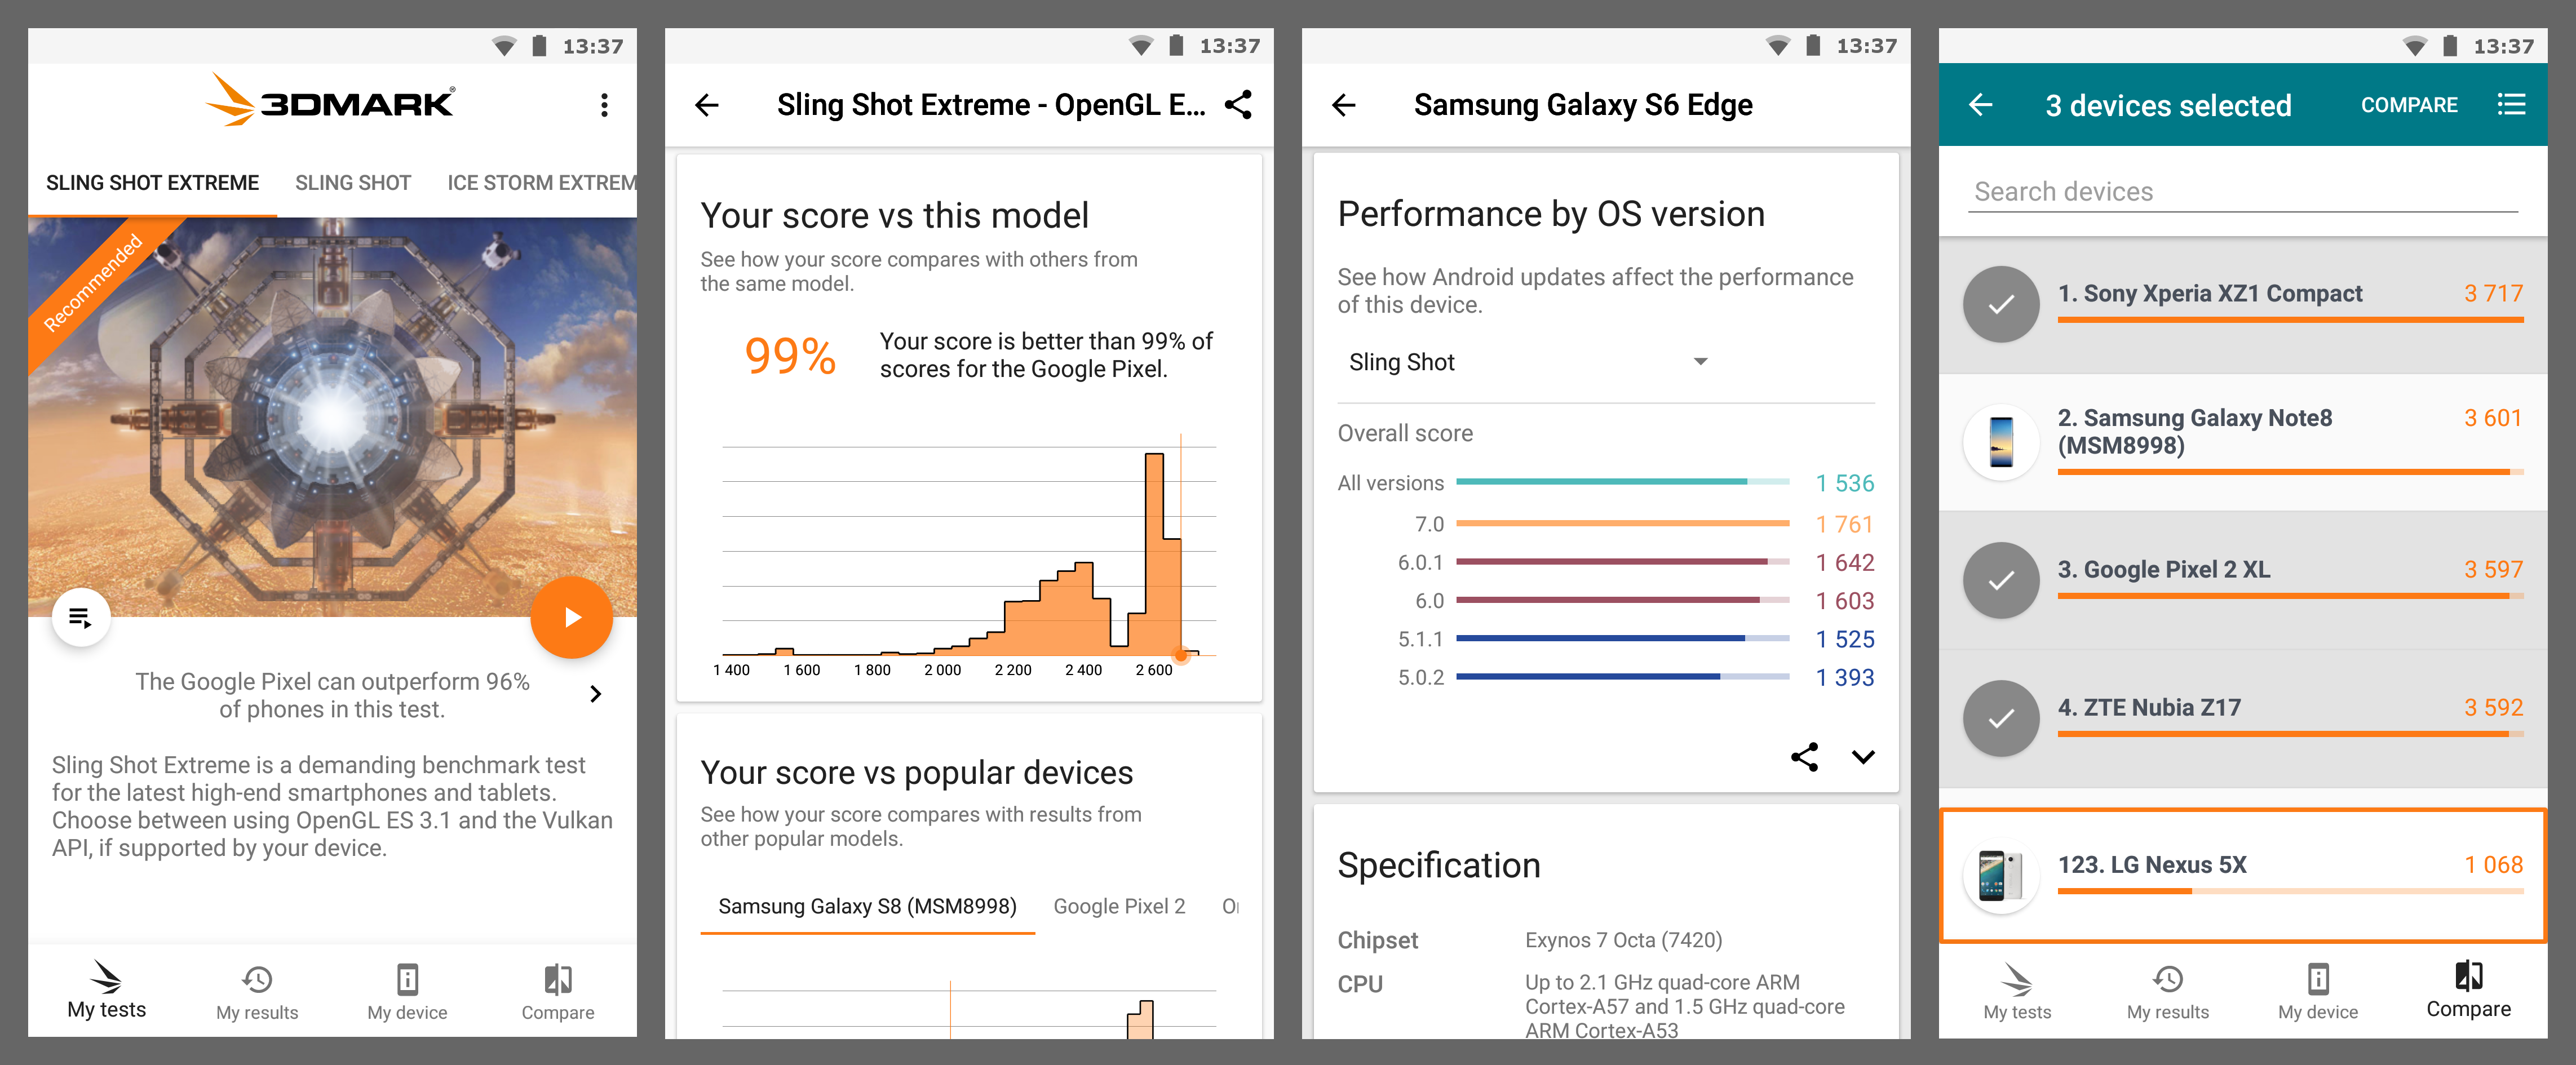
The new app helps you answer questions like,
- Is my score a good score for this device?
- What do other people with the same model score?
- How has my device's performance changed with OS updates?
- How does my device compare with other popular models?
- Which devices can perform consistently without slowing down?
Real-world performance revealed
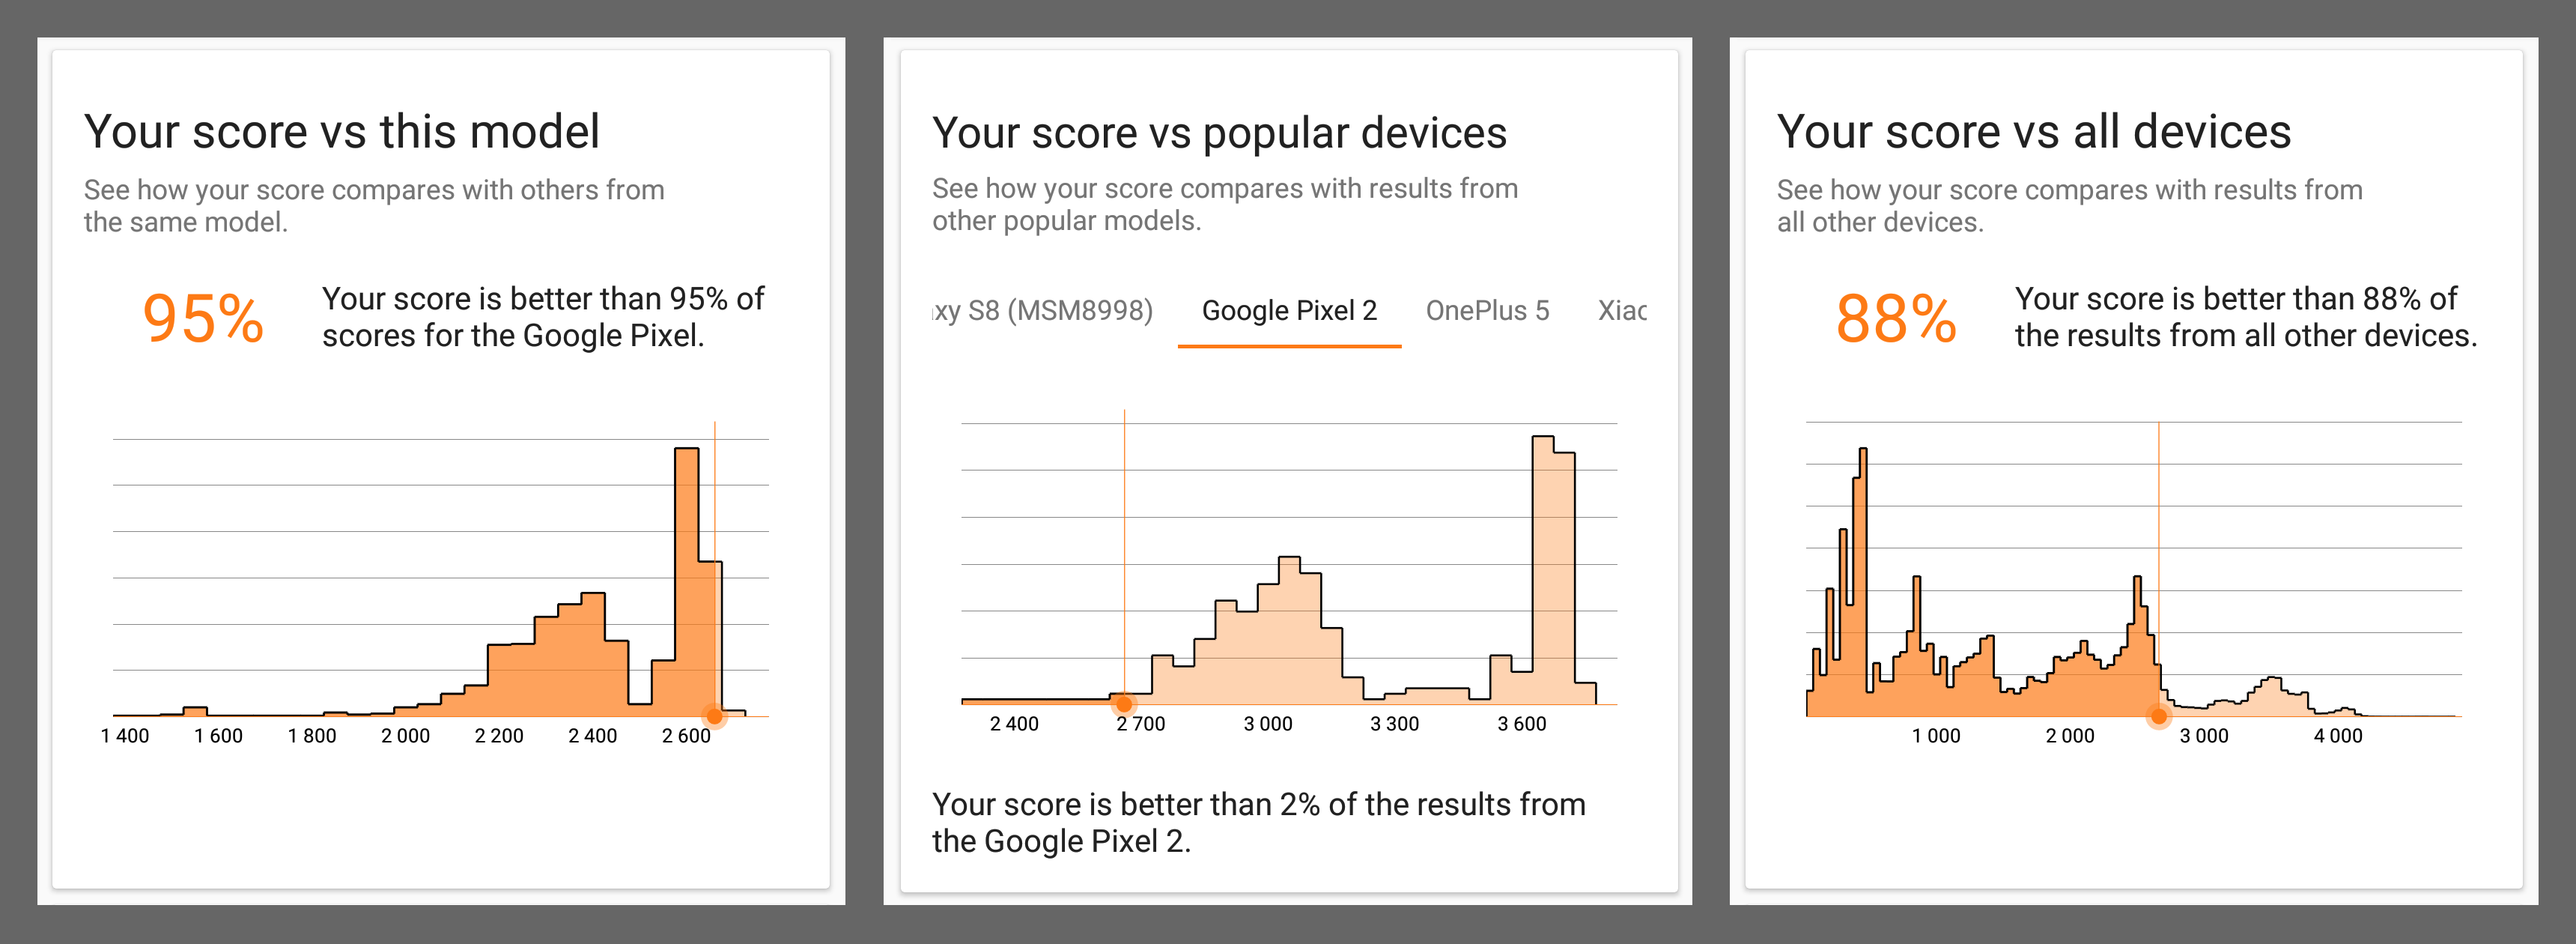
Average benchmark scores are good for comparing devices, but 3DMark now goes further by showing you the full range of scores for each device in a unique new chart.
These charts, showing the range of results submitted by 3DMark users around the world, give you the complete picture of a device's performance outside of the test lab.
Looking at the chart below, for example, the peak shows the most common scores for the device. The higher the peak, the more results there are around that score value. In this case, you can see that all the results tend to fall in the same narrow range. This means the device performs consistently even when the benchmark is running under less than ideal conditions.
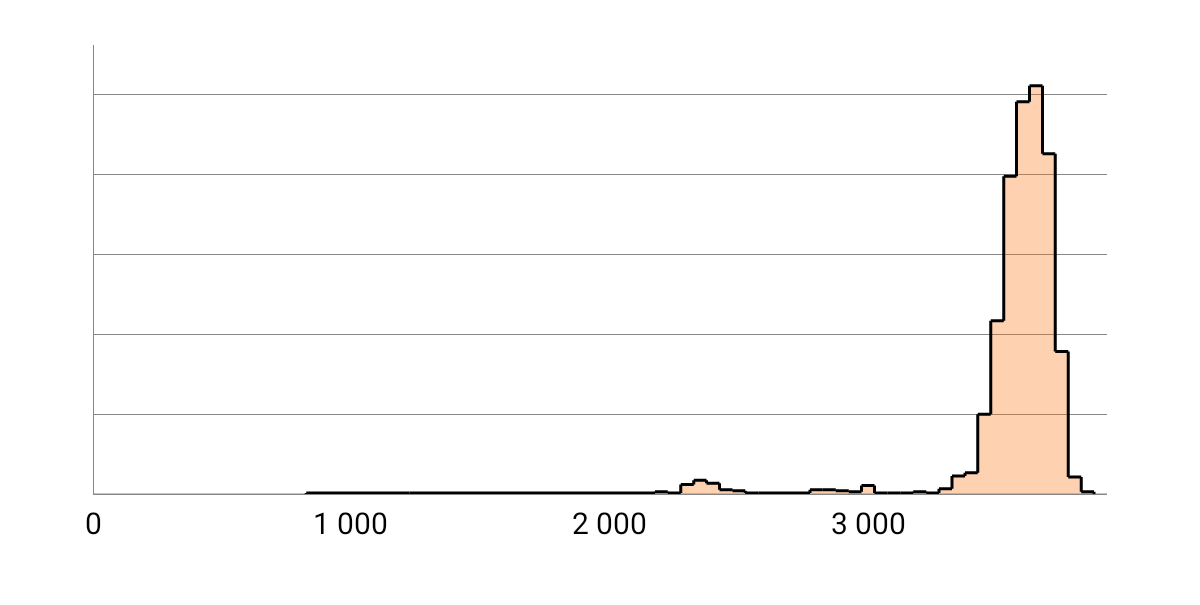
3DMark score range for a device with consistent performance.
In the next chart, however, we see a different performance profile. There are four distinct peaks spread over a wide range of scores. A chart with this shape tells you that, even though the device can score nearly as well as the first device, it cannot perform to that level consistently in real-world use.
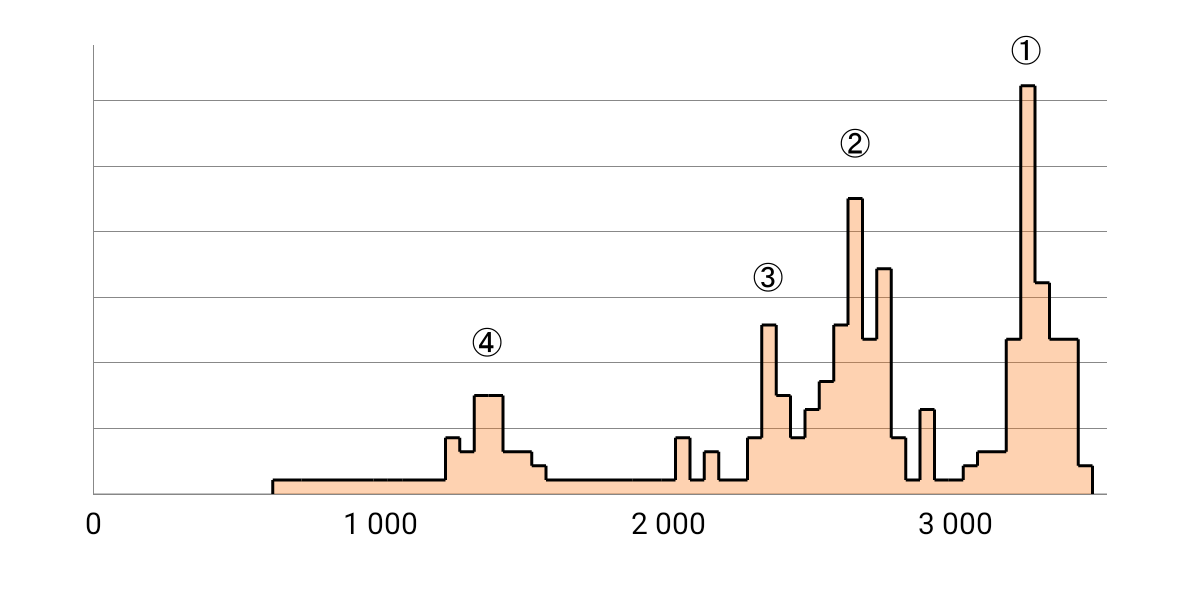
Score range showing levels in performance due to thermal issues.
The rightmost peak (1) shows the score the device can achieve under ideal conditions. Peaks (2) and (3) tell you that this device slows down when hot or when multitasking. Many devices tend to reduce performance in steps, and those steps are visible in the chart. Lower scores may also come from devices running an older version of Android. The leftmost peak (4) shows you that the device's real-world performance can sometimes be far below the optimum.
These charts are available in the app for every one of the almost 5,000 smartphones and tablets in our database. For each device, there is a separate chart for each 3DMark benchmark test.
There are sure to be some fascinating insights waiting to be discovered by comparing the charts for popular models. You can also use these charts to see if thermal issues are unique to a device or common to all models that share the same chipset.
Fast, responsive, and easy to use
With smooth animations and consistent interactions in an interface built on Material Design principles, the new 3DMark app is a breeze to use. The app is also faster and more responsive than ever. On older phones, for example, 3DMark now starts up to 85% faster than the previous version.
We've made it easy to save and share your results, comparisons, charts, and many of the other screens in the app. Whenever you see the share icon, tap it to save and share an image of the current screen.
Download
3DMark is a free Android benchmark app available from Google Play.
![]()
Check out our new technical guide for the Android version. It includes a guide to all the new features in the app as well as explaining what each test measures and how the scores are calculated.
Recent news
-
Announcing our next generation 3DMark GPU Benchmark and its first sponsor
June 3, 2026
-
Launching Procyon Essentials: a browser-focused benchmark for multitasking professionals
May 5, 2026
-
3DMark on MacOS now available directly from UL Solutions.
April 22, 2026
-
3DMark delisting of REDMAGIC 11 Pro phones
April 9, 2026
-
Introducing Computer Vision 2.0, Our Next‑Generation AI Hardware Benchmark
March 30, 2026
-
Procyon® AI Benchmarks Provide Full Coverage and Actionable Performance Insights
January 13, 2026
-
Procyon Labs launches with FLUX.1 AI Image Generation Demo
November 4, 2025
-
3DMark Solar Bay Extreme is available now!
August 20, 2025
-
3DMark Speed Way Teams up with PC Building Simulator 2!
July 17, 2025
-
New Procyon AI Benchmark for Macs now available
June 25, 2025
-
3DMark for macOS available now!
June 12, 2025
-
New Inference Engines now available in Procyon
May 1, 2025
-
Try out NVIDIA DLSS 4 in 3DMark
January 30, 2025
-
Test LLM performance with the Procyon AI Text Generation Benchmark
December 9, 2024
-
New DirectStorage test available in 3DMark
December 4, 2024